Smart Energy Water · 2024–2026
Other work: billing, surveys and admin
- Role
- Senior Product Designer
- Company
- Smart Energy Water
- Timeline
- 2024–2026
- Location
- Irvine, CA
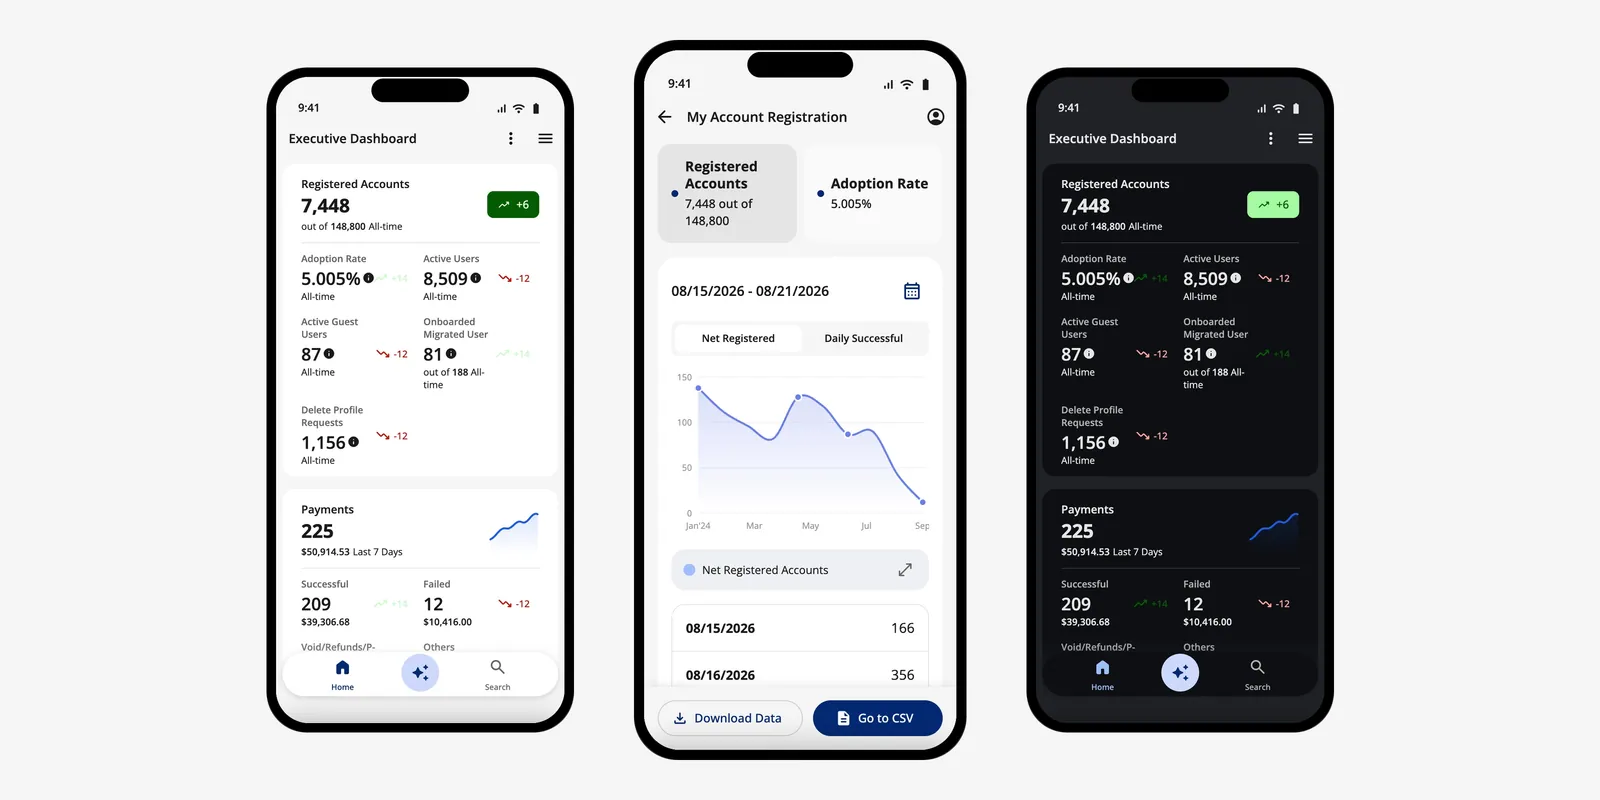
SmartBX Mobile: dashboard, drill-down and dark mode. Coded prototype, invented data.
Contents
- SmartBX Mobile: a utility's key numbers, on an executive's phone
- AutoPay with a backup payment method, the same way everywhere you pay
- Surveys, from the customer's home profile to an admin survey builder
- Smart Home Energy Reports (SHER): campaigns a utility can run itself
Shorter projects that show range across SEW's suite: SmartBX Mobile, customer billing, surveys and admin tools. Each is one story, my role and an honest status.
SmartBX Mobile: a utility's key numbers, on an executive's phone
SEW's admin product, SmartBX, had an Executive Dashboard on its web portal and no phone app. I took the portal as the base and moved it to mobile for utility executives: seven numbers on one screen, and one drill-down pattern behind each. I built it in code four times with Claude Code on our shared component library, ending with a tap-through handoff for engineering.
- Area
- SmartBX admin
- When
- Feb–Aug 2026
- Role
- Designer of the mobile Executive Dashboard; built every coded version (with Claude Code).
- Status
- Figma design plus coded prototypes. My code didn't ship; engineering built the design, and it is live for a utility.
-
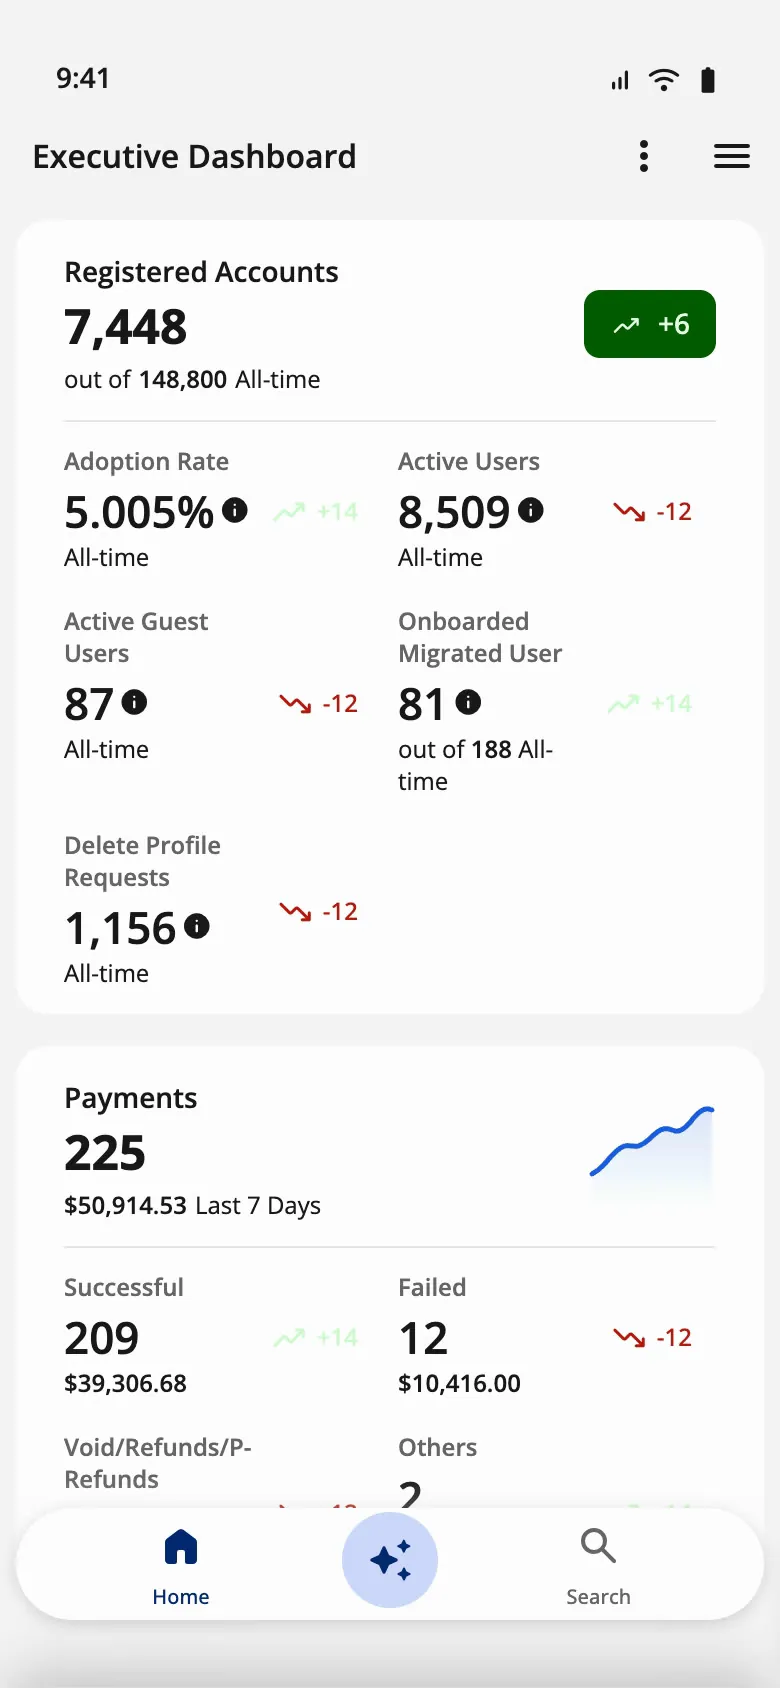
Design-system build · Executive Dashboard, light
-
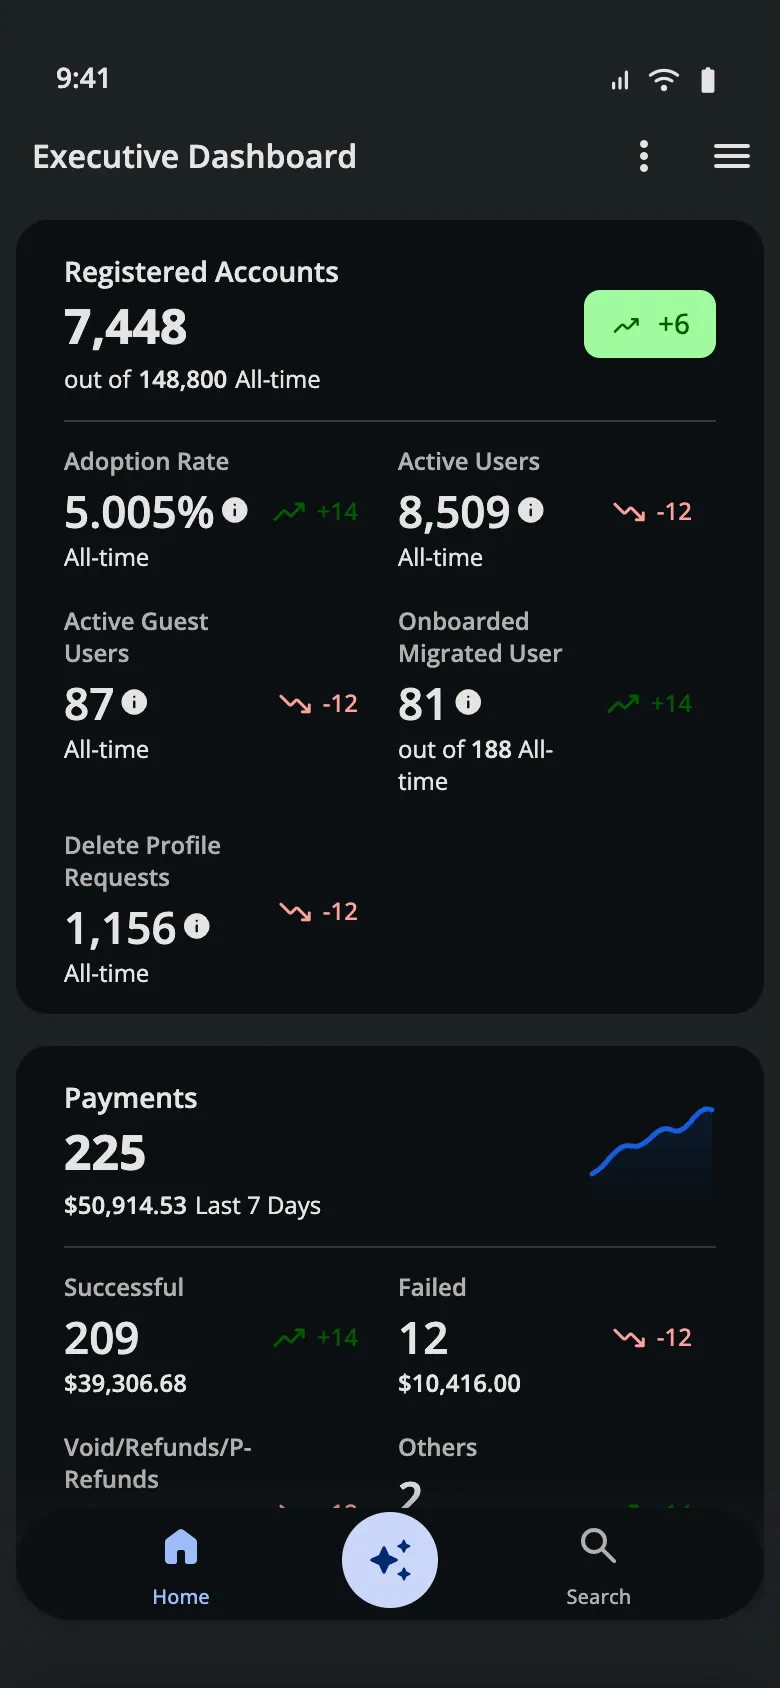
Design-system build · Executive Dashboard, dark
-
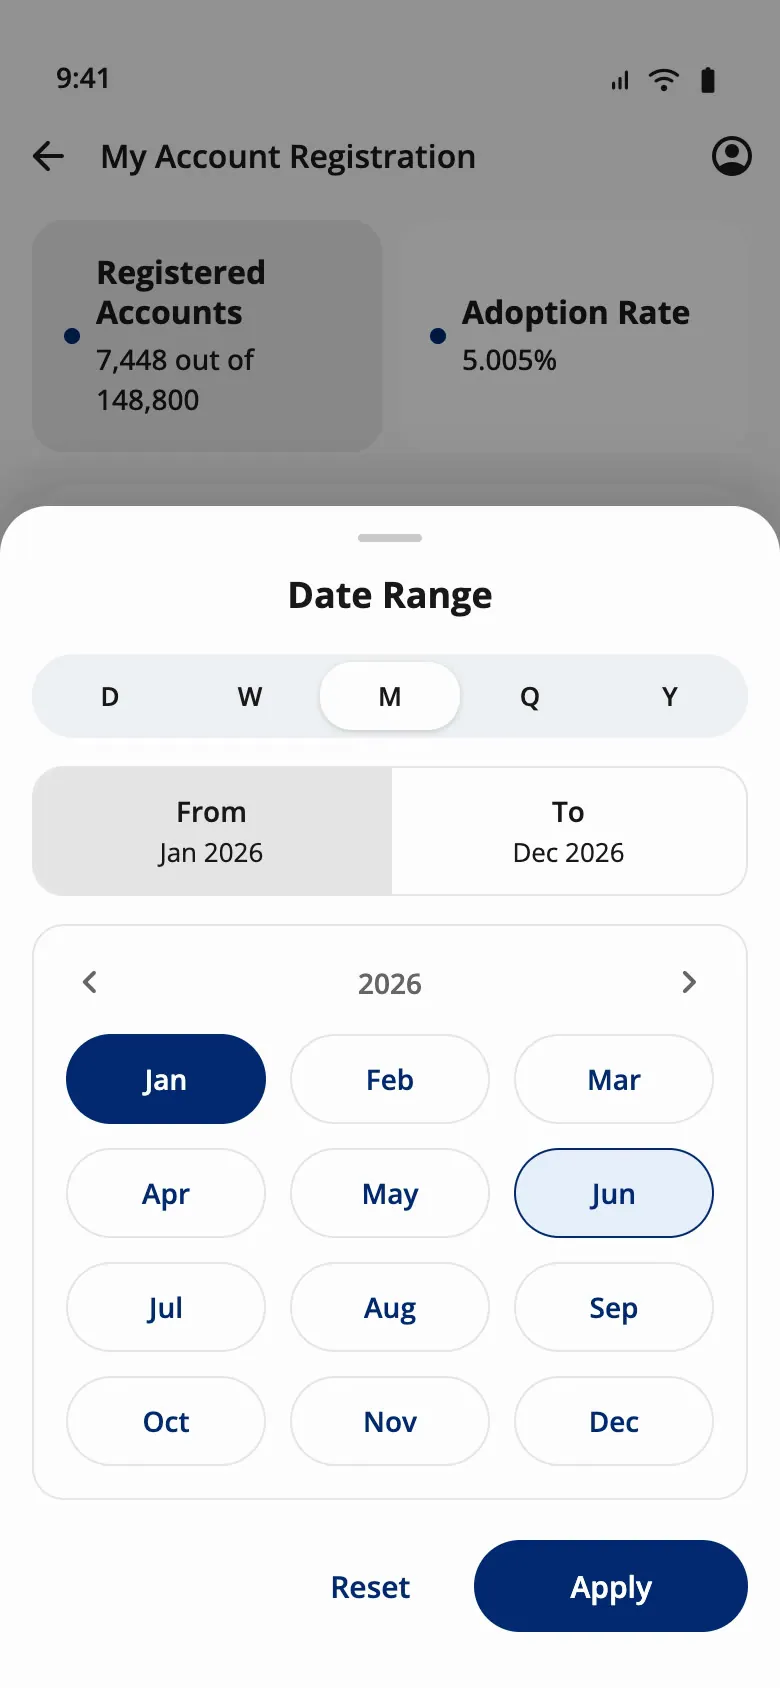
Design-system build · Date range sheet
-
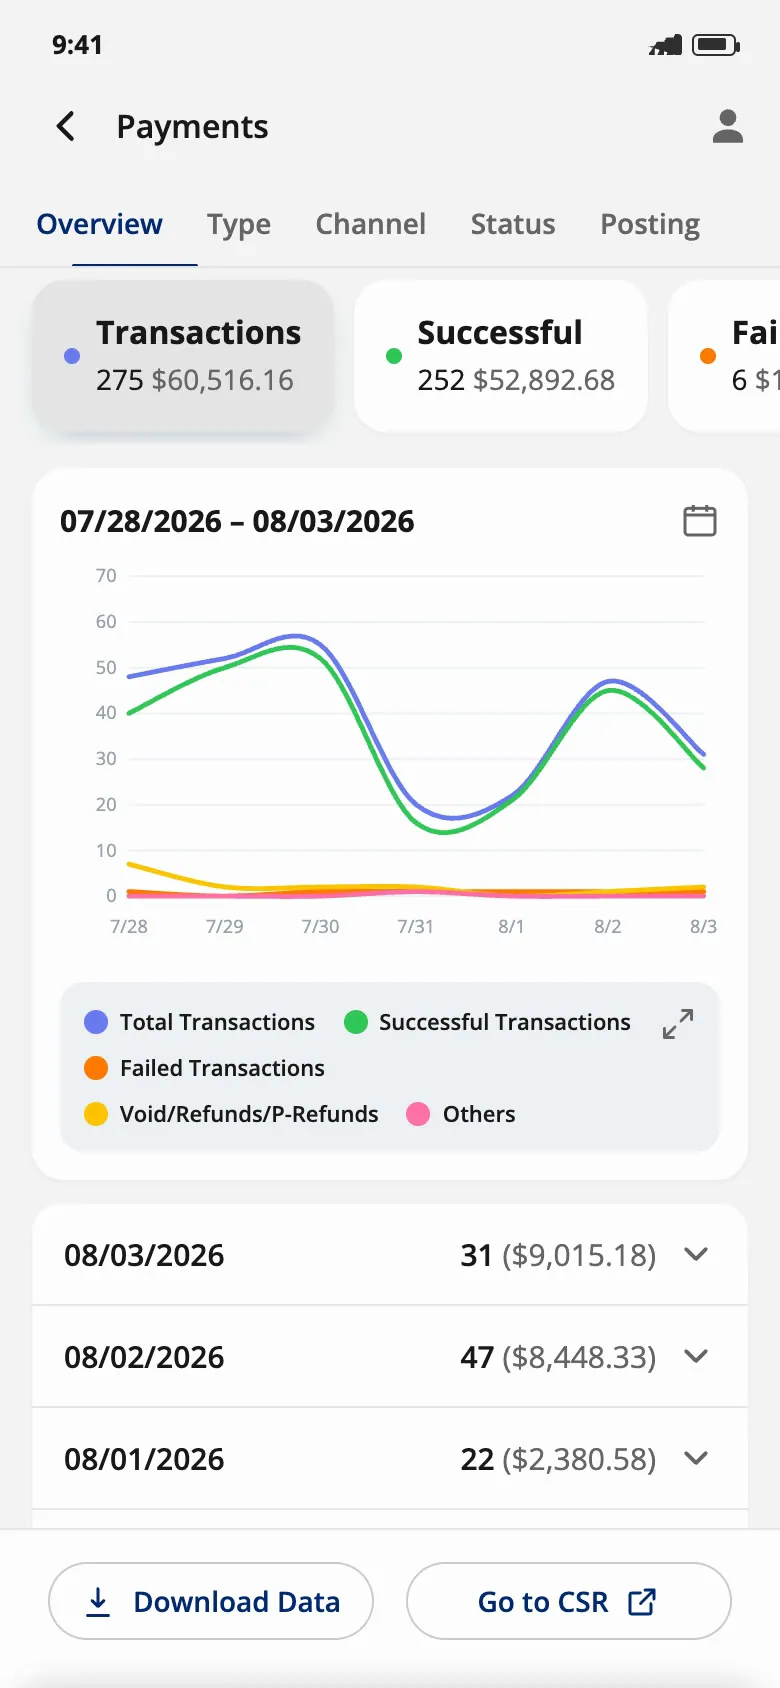
Engineering handoff · Payments drill-down
-
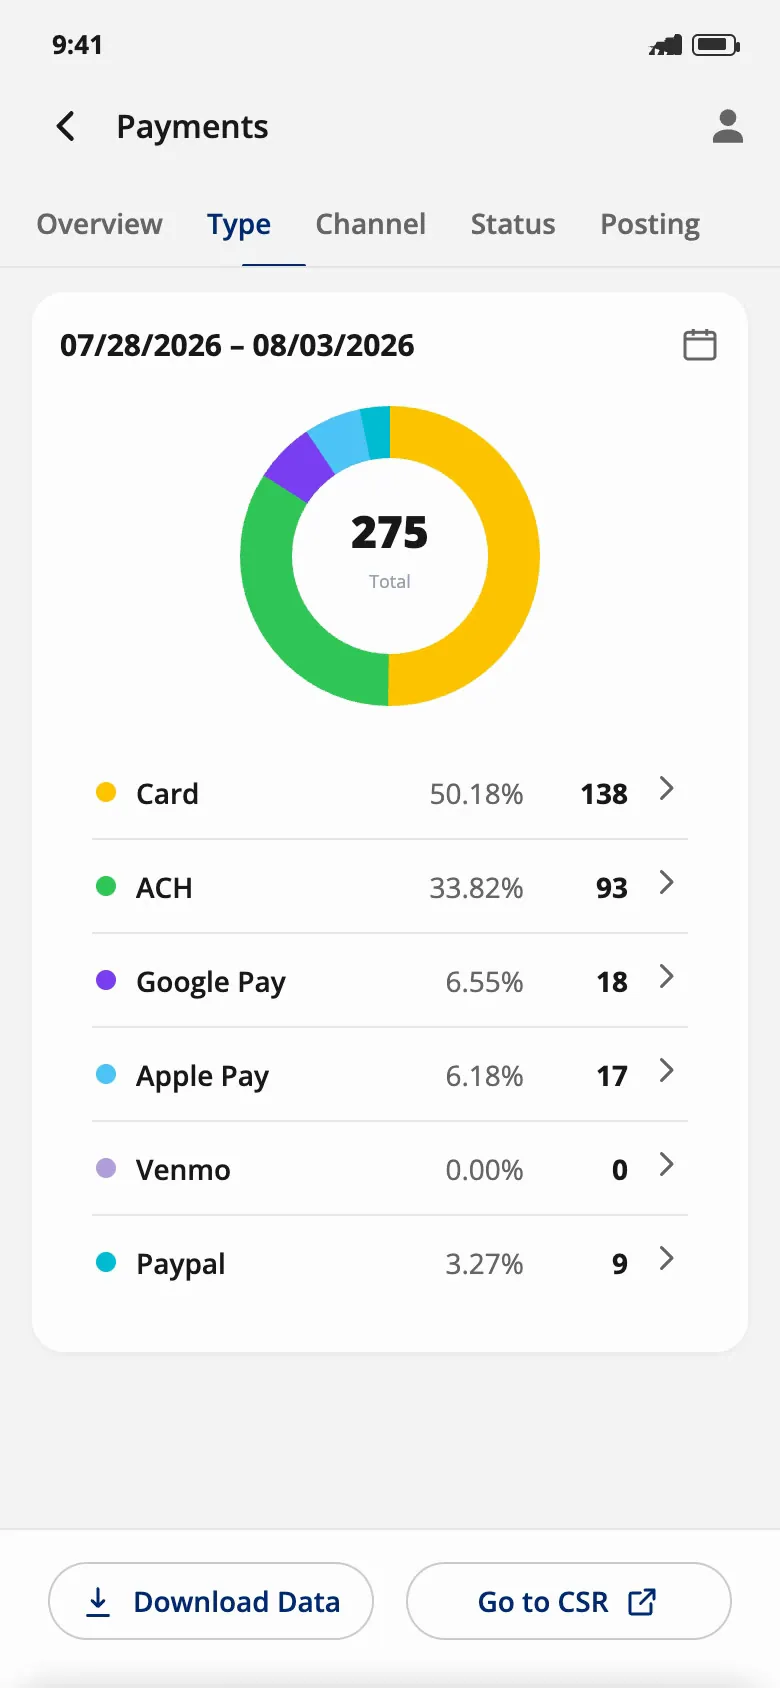
Engineering handoff · Payments by type
Why it mattered: executives wanted their utility's numbers without opening a laptop. Starting from the web portal, not a blank page, meant every number and pattern already had an owner and a definition, so the phone app only had to decide what comes first.
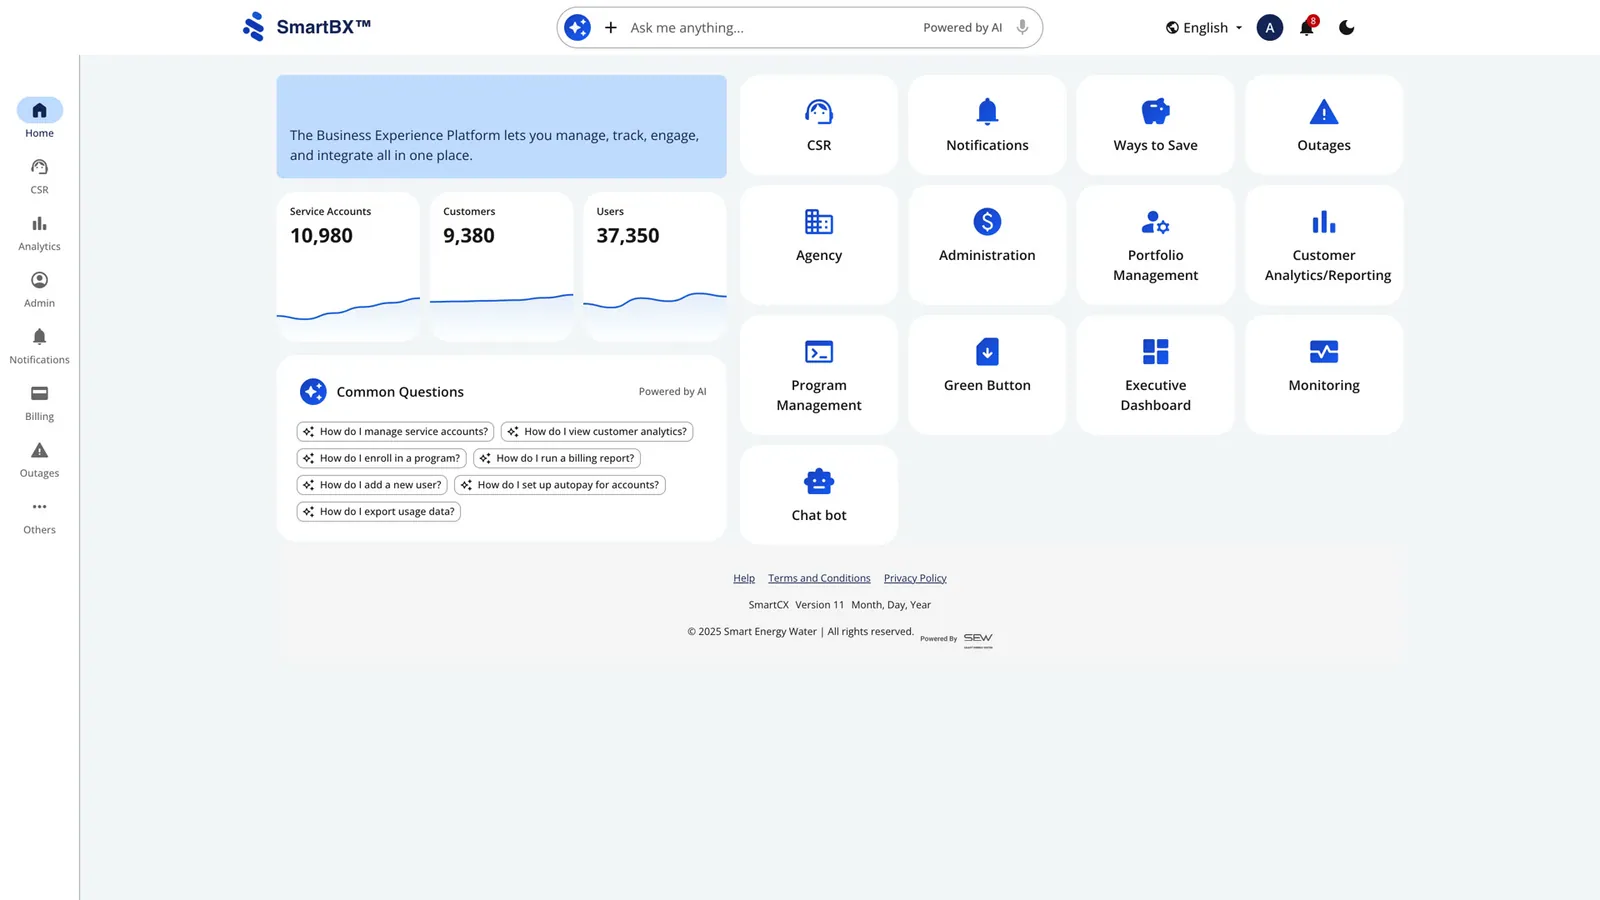
The portal was the base; the phone had to edit it
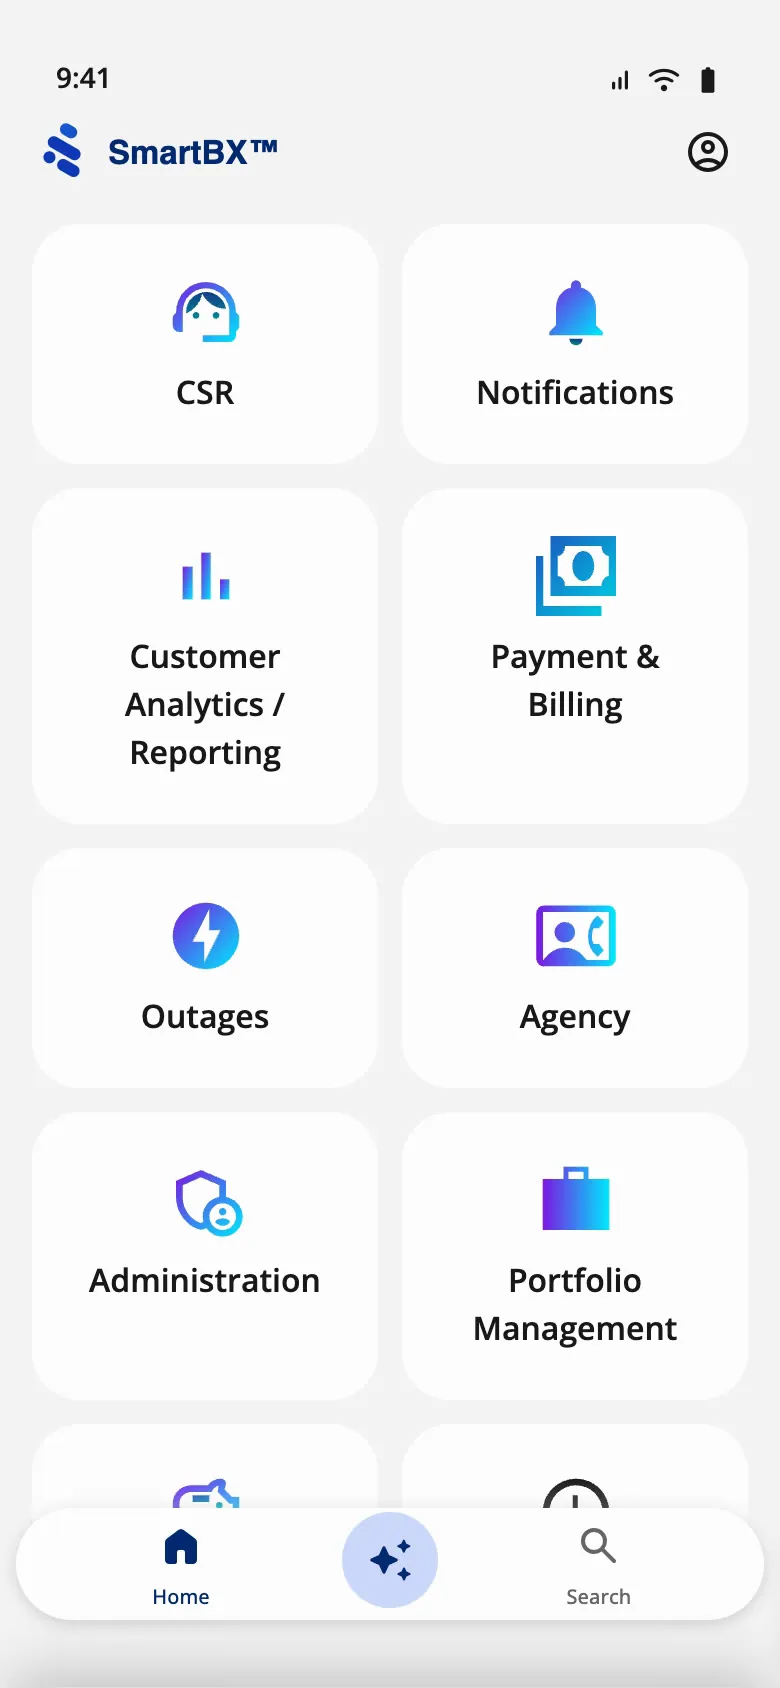
Nothing on the phone was invented from scratch. Every number, module and pattern already existed in the web portal. The job was deciding what an executive needs first, and reshaping each pattern for one hand and a small screen.
Web portal
- Portal home: rail, tiles and KPI cards
Phone
- Home: the same modules as tiles
- Executive Dashboard: KPI cards
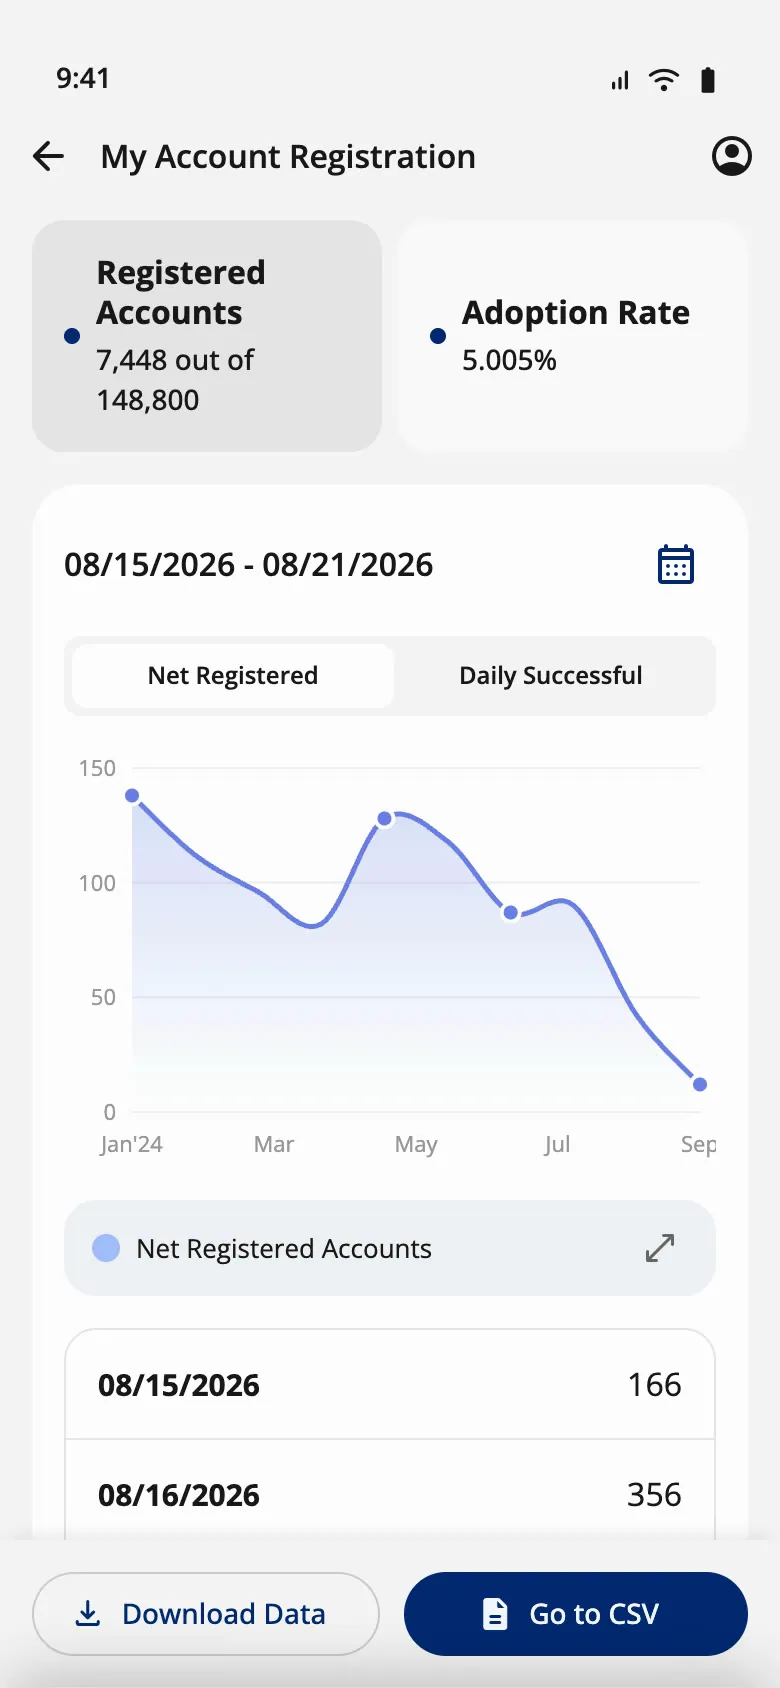
- Drill-down
- Date range as a sheet
- On the phone The tile grid becomes the home screen; each tile drills down
- Why One thumb, one column. Tiles were already the portal's mental model, so nothing new to learn.
- On the phone Seven KPI cards, each with its time frame
- Why Executives check a number first and only sometimes want the detail.
- On the phone A daily table under each chart, rows that expand into breakdowns
- Why Columns don't fit; rows do.
- On the phone A bottom sheet with Day, Week, Month, Quarter, Year
- Why "Last quarter" is how executives ask, not two dates.
Seven numbers up front, one pattern behind each
On a phone, an executive needs the headline number first, then details on request. So the app has three layers, plus a way to act:
- Home The SmartBX module launcher; Executive Dashboard is one tile
- Dashboard Seven cards: registrations, paperless, payments, service requests, notifications, AutoPay, text-to-pay
- Drill-down One page per card, all built from the same template
- Act Download the data, or jump to the CSR tools
Each of the seven pages answers its question the same way, so an executive only has to learn one page:
- Summary tiles across the top Each tile shows a total and its color matches its line in the chart. When you scroll, the tiles collapse to their titles and stay pinned.
- A date range you can always see The range sits above the chart, with a calendar button that opens a bottom sheet.
- One chart, with a switch for the chart type Line by default; stacked bars or a donut where proportions matter more than trends.
- A daily table under the chart One row per day. Rows expand into breakdowns by status, channel or type, so the exact numbers back up the chart.
- Two actions, pinned to the bottom Download the data, or go to the CSR tools to act on it. The phone is for checking; the work happens in the portal.
A date picker that starts from how executives think
Executives ask about "this week" or "last quarter", not a pair of dates, so the date range opens as a bottom sheet with Day, Week, Month, Quarter and Year at the top. Day shows a From/To calendar; Month and Year show grids of pills; Quarter shows cards.
-
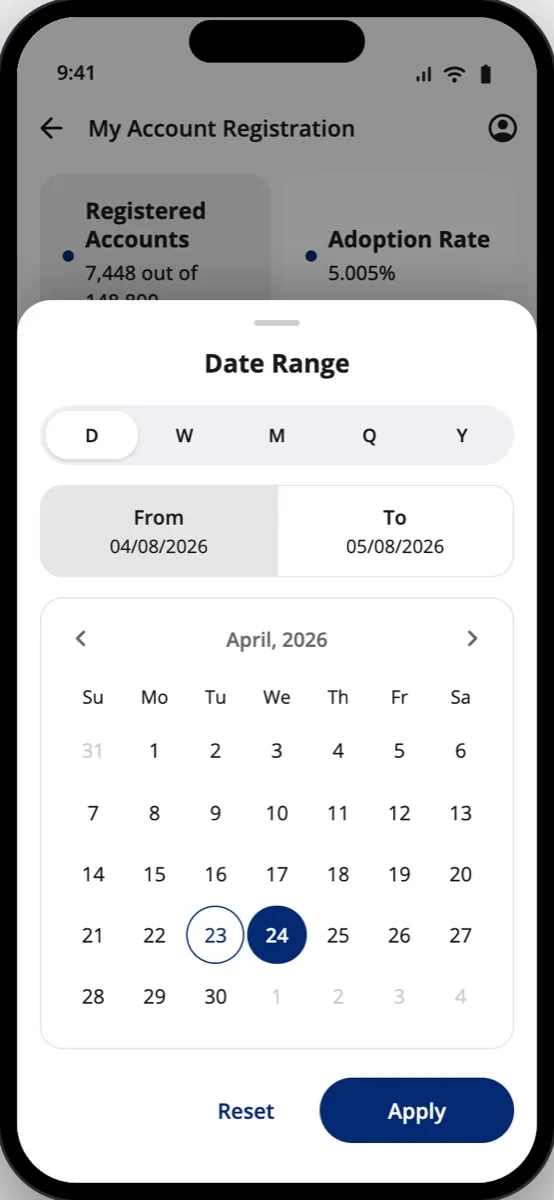
Day · The sheet, set to Day
-
Month · Month: a grid of pills
-
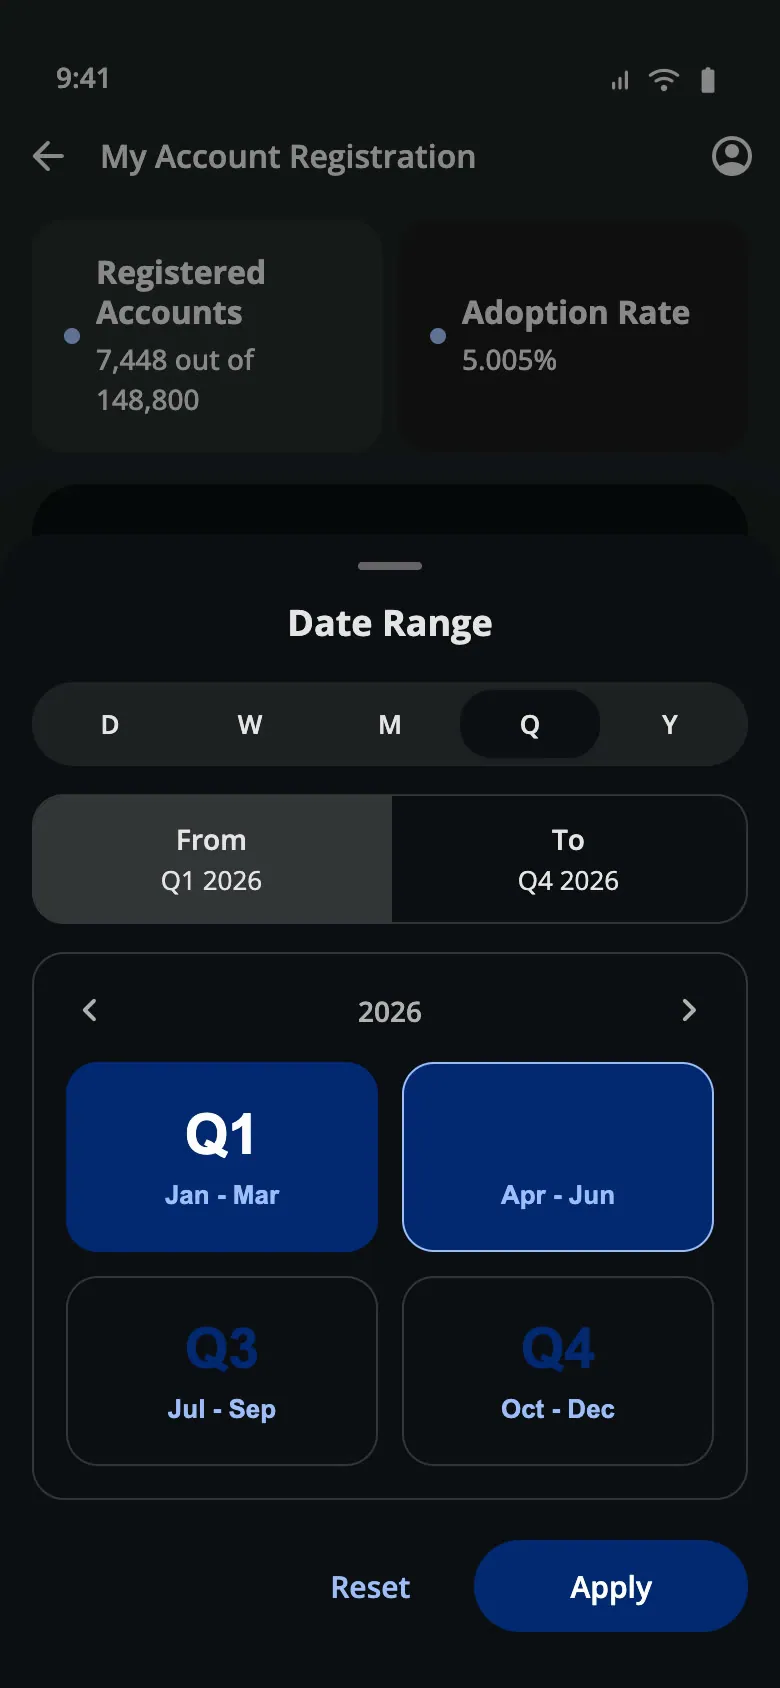
Quarter · Quarter: cards (dark)
From a Figma first pass to an engineering handoff
Two rounds in Figma, then four coded builds. The first Figma pass put a sparkline on every card; 2.0 cut the cards to a number and a time frame, and gave each one a full drill-down. Each coded build then answered one question the Figma file couldn't.
-
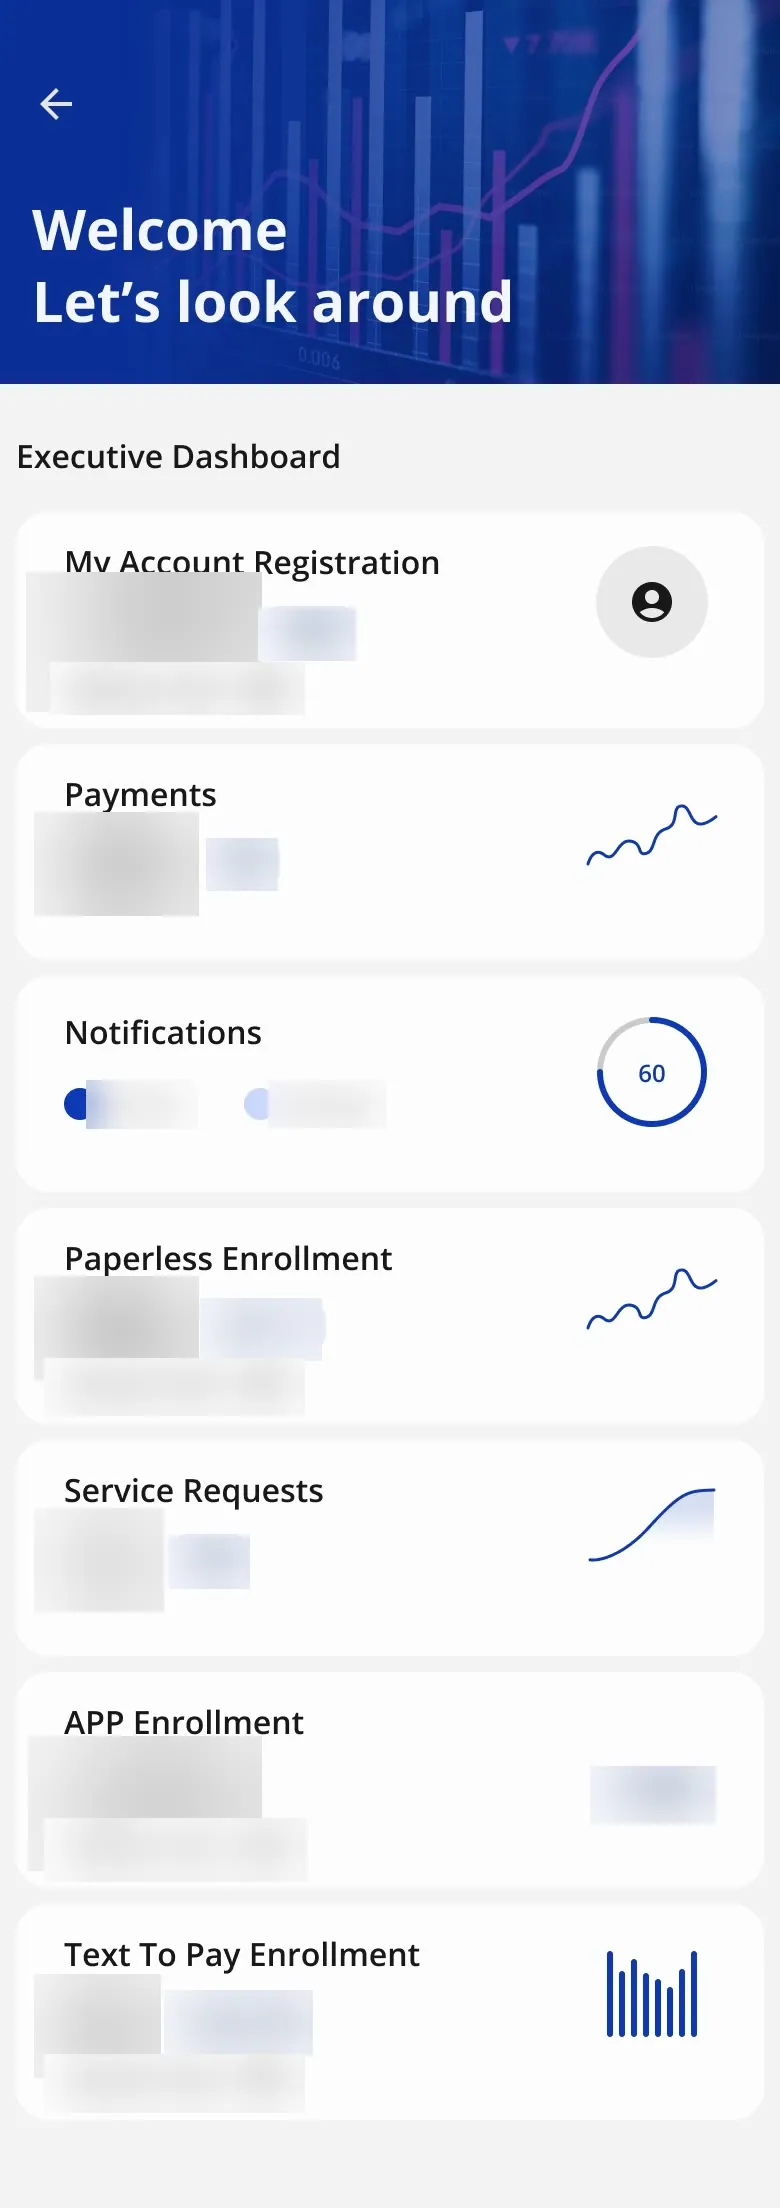
Figma, first pass · Executive Dashboard, sparkline cards · scroll ↕
-
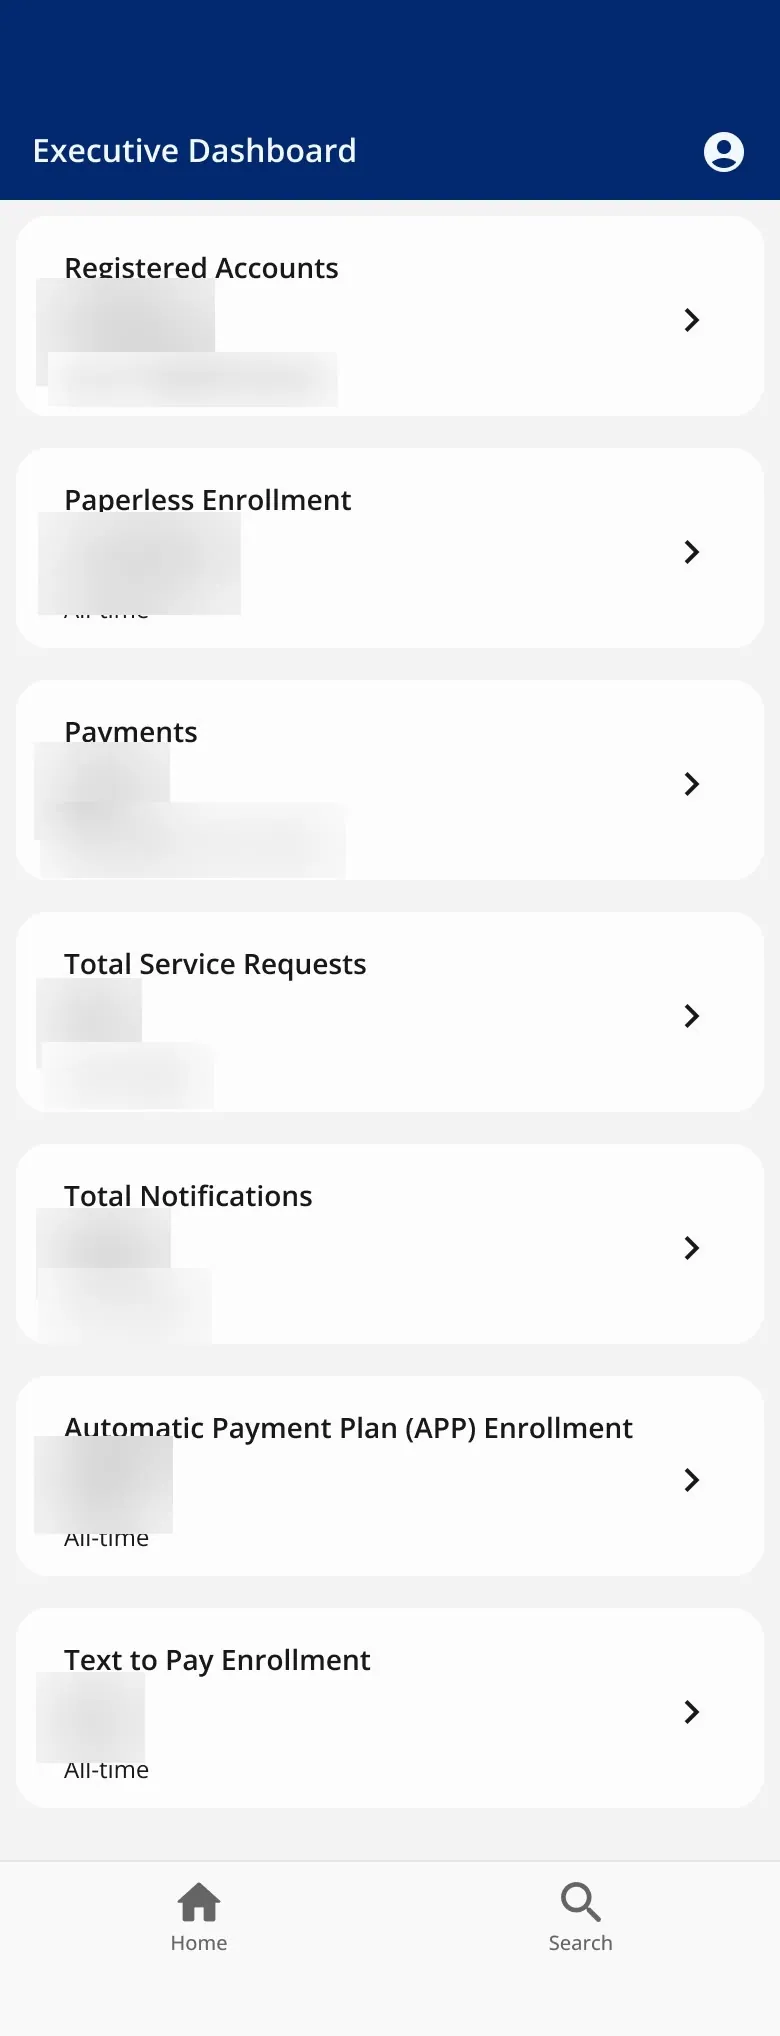
Figma 2.0 · Executive Dashboard, plain cards · scroll ↕
-
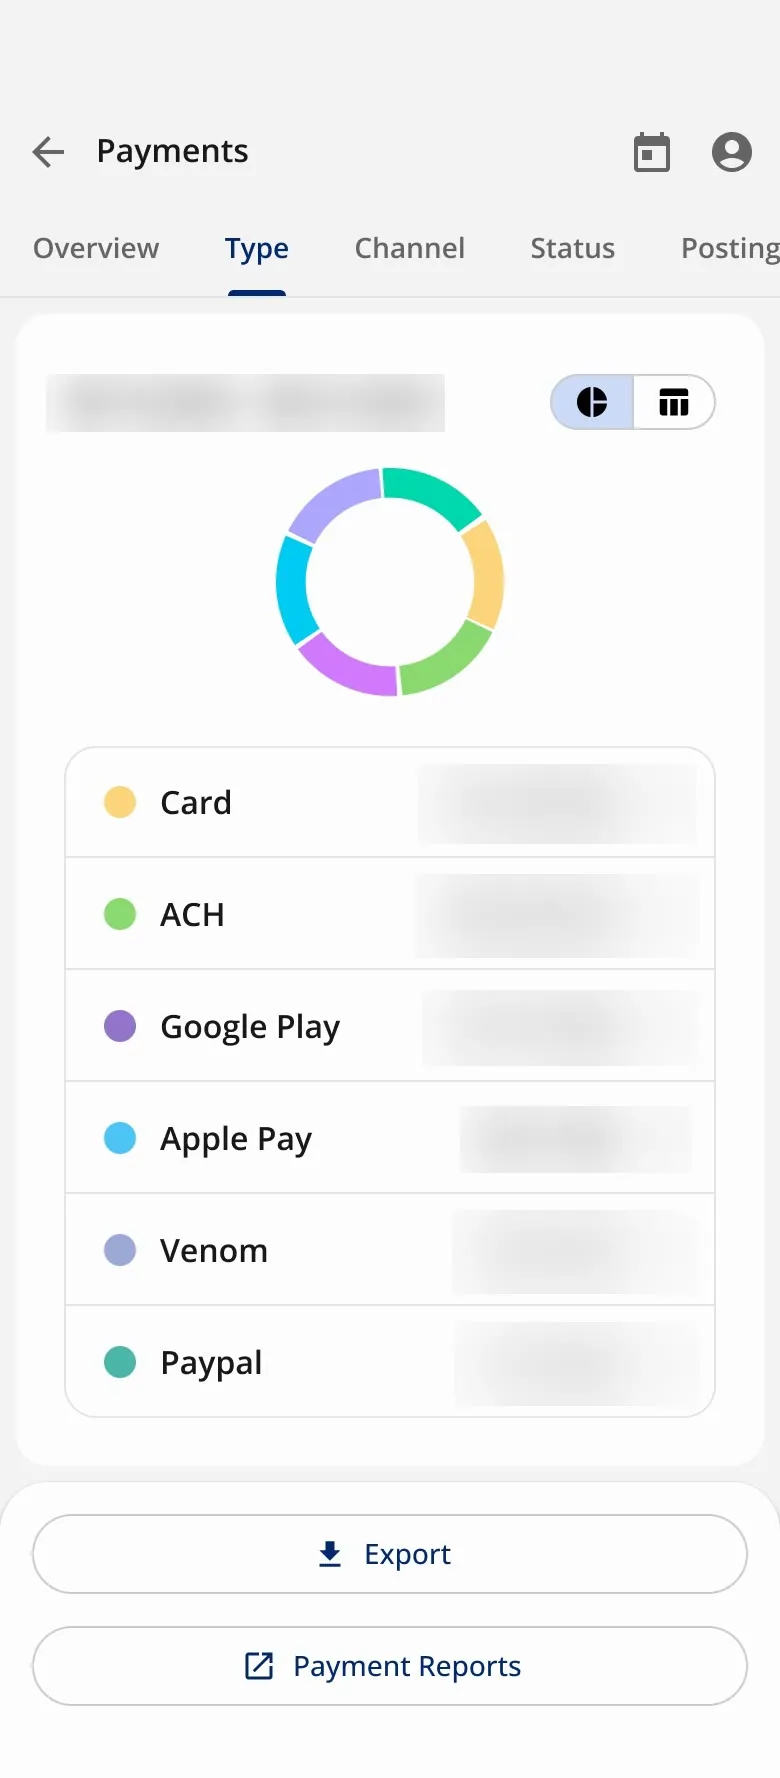
Figma 2.0 · Payment types, donut
-
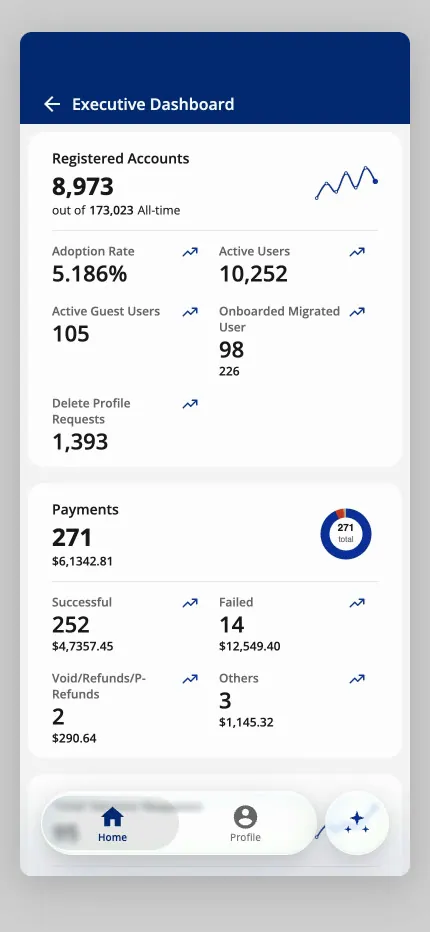
First Claude prototype · Dashboard, first coded pass
-
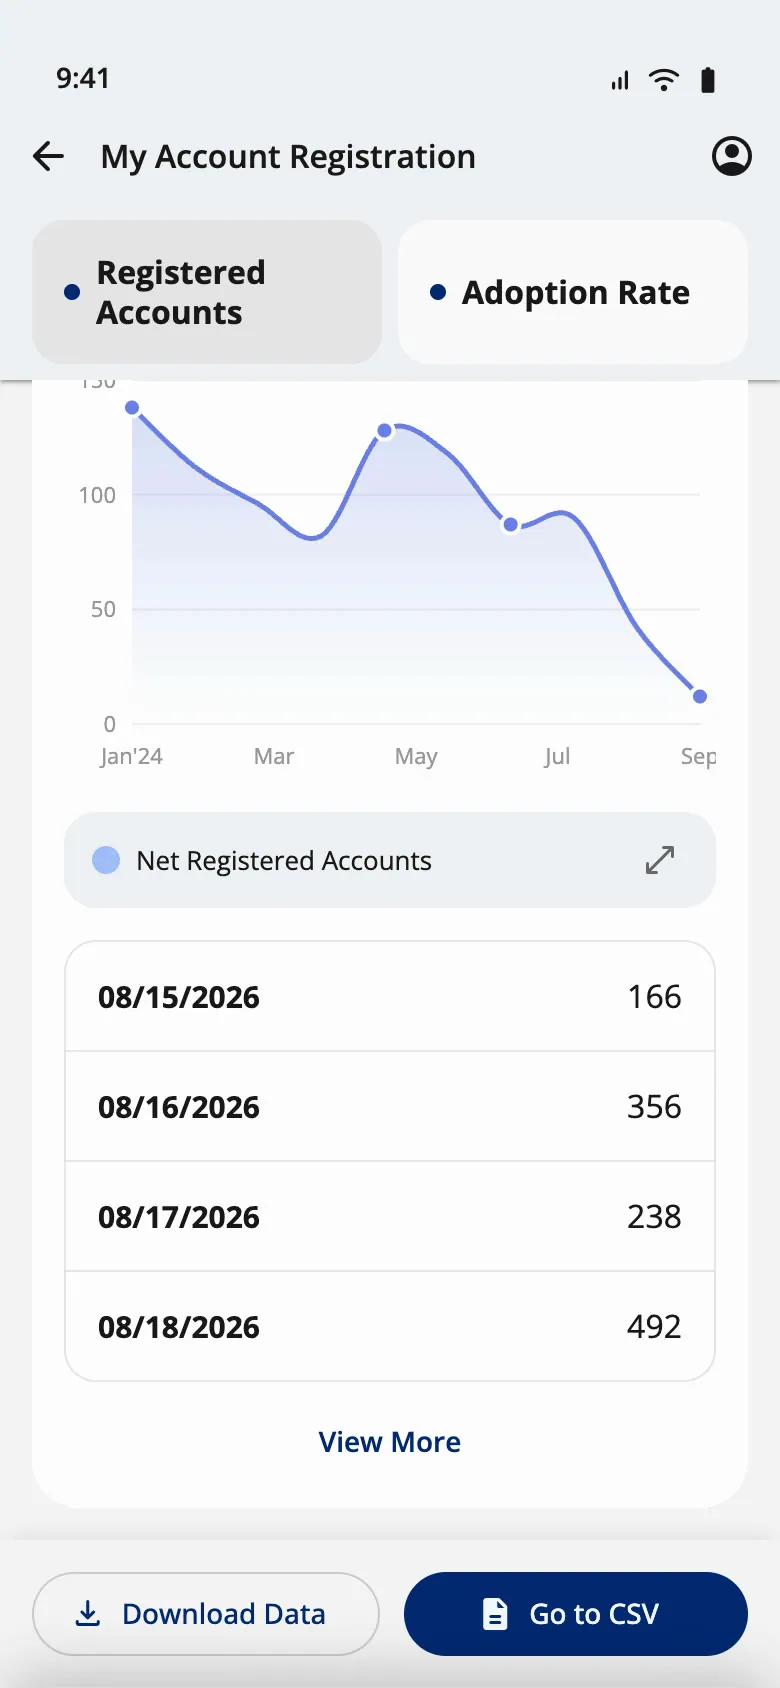
Design-system build · Tiles collapsed on scroll
-
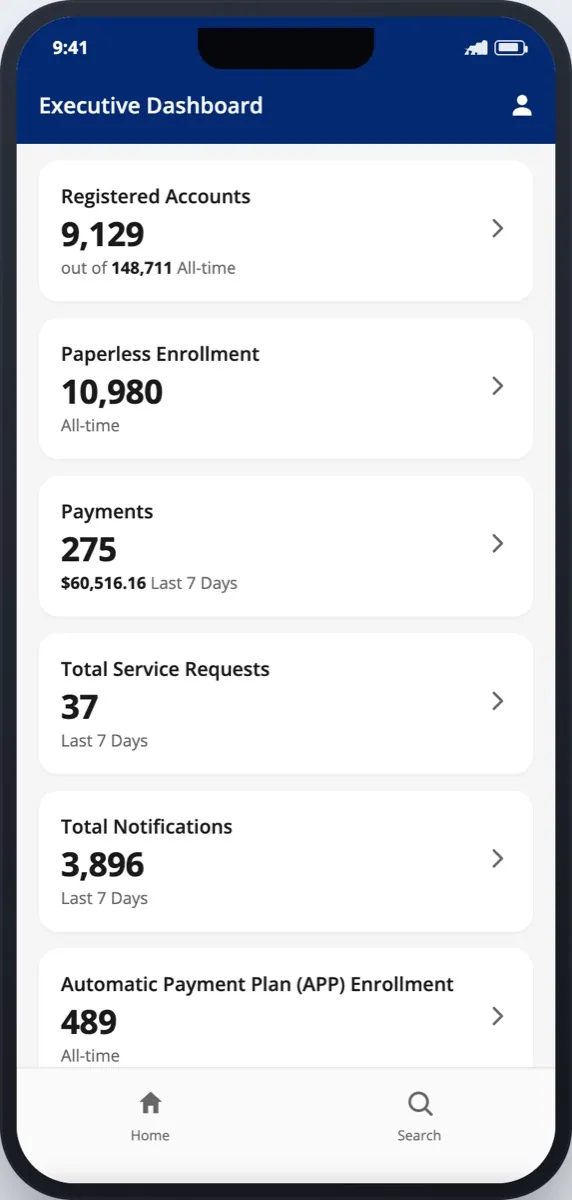
Engineering handoff · Dashboard: one card per number
-
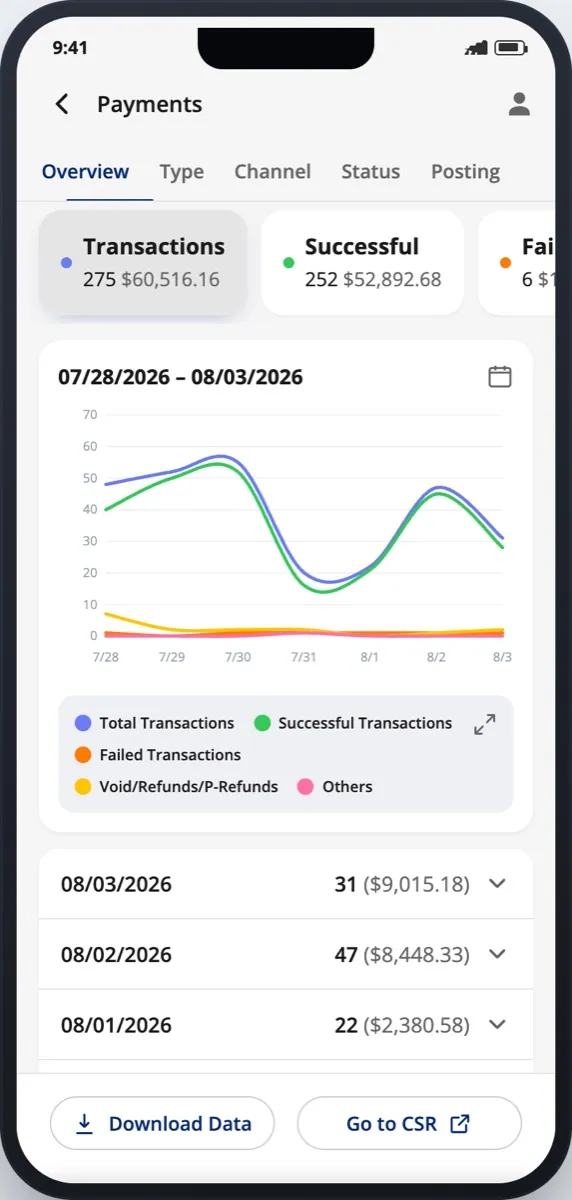
Engineering handoff · Payments: Overview, Type, Channel, Status, Posting
- Mar 2–4 Mobile web, 6 pages How the Figma prototype feels in the hand: the glass nav bar, iOS push transitions, bottom sheets, and an AI button that opens a chat overlay.
- Mar 5 Native screen (Expo) What a native app would look like if it copied the existing web dashboard. It showed that the web page needed rethinking, not just shrinking.
- Jun 17–19 Design-system React Can the dashboard be built from the shared component library? It added three components to the library (v0.8.0), including the tab bar that collapses on scroll.
- Aug 4 Engineering handoff All seven drill-down pages, tap-through, matched to the Figma tokens, with a written spec for every animation. I made 8 versions in about 70 minutes.
Rebuilding this dashboard on the library led to a brief for one shared repository, which became Prototype Studio: designers describe a screen and get it on the real system. → Prototype Studio
The issues the builds surfaced
Building it for real showed problems a static Figma frame hides. I logged each one, and what it taught:
Contrast
In dark mode the navy logo, the calendar icon and the selected Quarter label nearly vanish.Brand colors need a dark-mode token, not the light one reused.
Data
Commas in the wrong place, a header total that didn't match its cards, trends that never moved, chart axes that didn't match the table.Derive every number from one data set, so a mismatch can't be typed in.
Layout
The sticky header overlapped content, there was no tablet layout, and the handoff was fixed at 414 px wide.Decide the size range before the first build, not after.
Build
A font-stripping step broke icons, package sign-in kept failing, and a hosted link died.Ship prototypes as one file that opens offline. This is why every build here still works.
What was mine, and what wasn't
Mine
Design and every build- The mobile Executive Dashboard design in Figma: structure, drill-down template, date sheet, chart and data work
- All four coded builds, made with Claude Code
- The motion spec
Shared or inherited
The starting point- The CSR side of the SmartBX app was mostly another designer's file; I made some edits
- The list of numbers came from the existing web dashboard
- Product and engineering partners
Not claimed
What the files don't show- That my code shipped: engineering builds SEW's product on its own stack
- Any user research: nothing in the files shows executives were tested
- Any adoption or usage numbers
- A phone dashboard is an editing job. The web page had the data; the mobile version had to decide what comes first, and repeat one pattern so it only has to be learned once.
- Build to answer a question. Each of the four builds settled something the Figma file couldn't: feel, native fit, the design system, then the handoff. Claude Code made each one cheap enough to throw away.
AutoPay with a backup payment method, the same way everywhere you pay
Product asked for AutoPay to support a backup payment method. I designed it, then audited the other payment pages (Text to Pay and Make a Payment) so card entry, the saved-method picker, the backup method, review and confirmation work the same way in all three.
- Area
- Billing
- When
- Sep–Oct 2026
- Role
- Design and audit, web and mobile; Product drove the requirement.
- Status
- Designed; in development with engineering.
-
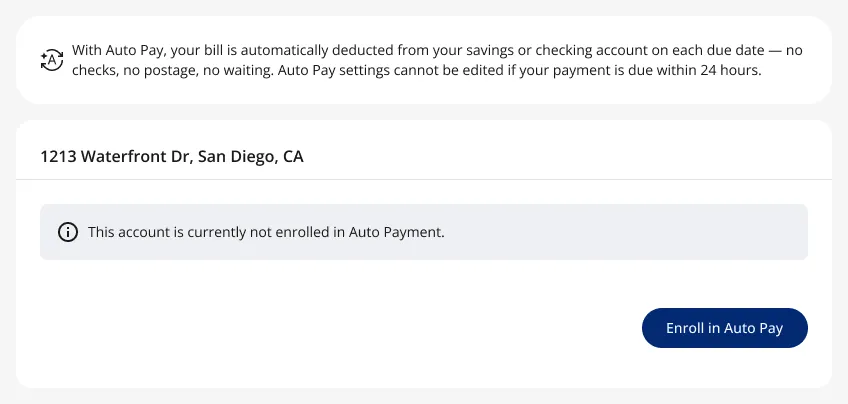
AutoPay · Not enrolled
-
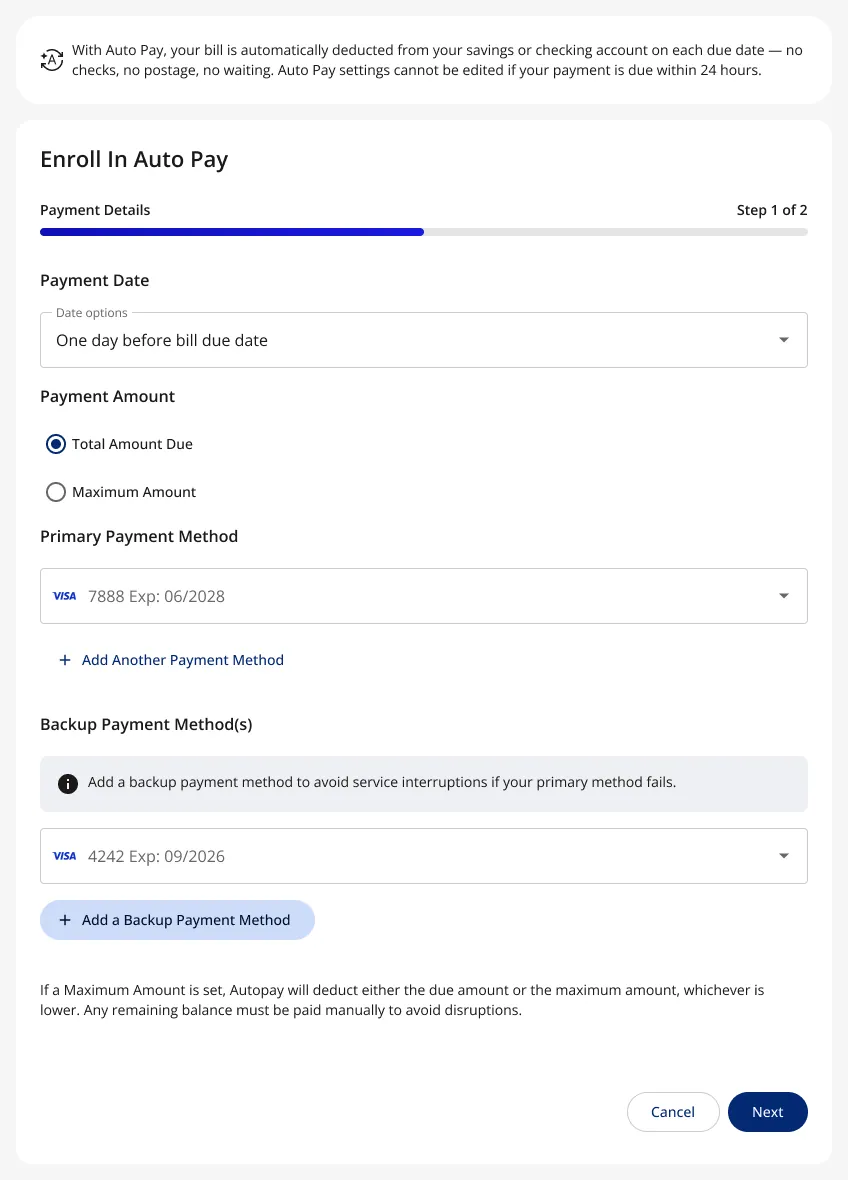
AutoPay · Primary and backup payment
-
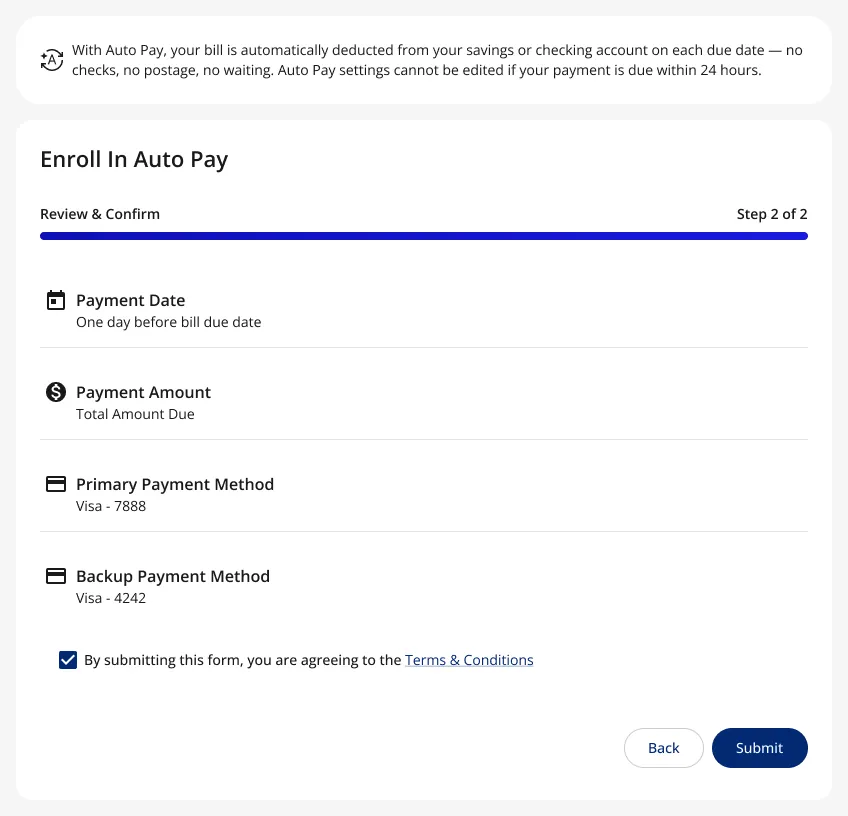
AutoPay · Review and confirm
-
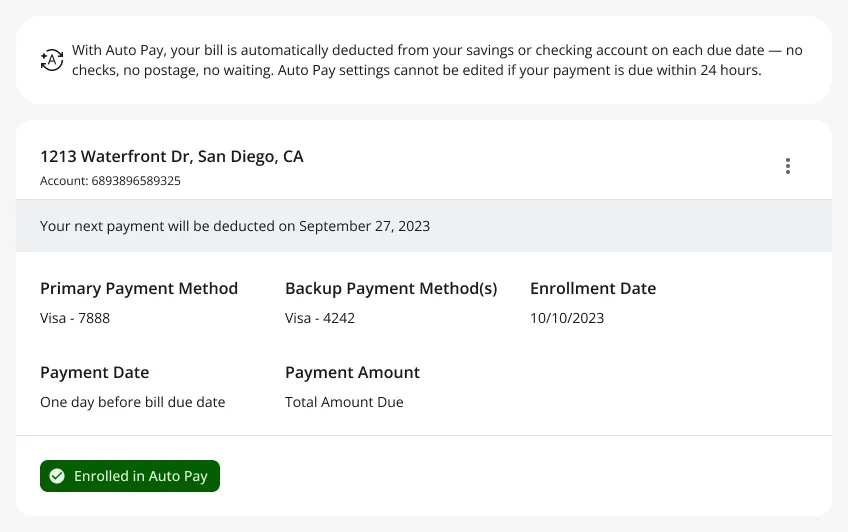
AutoPay · Enrolled
-
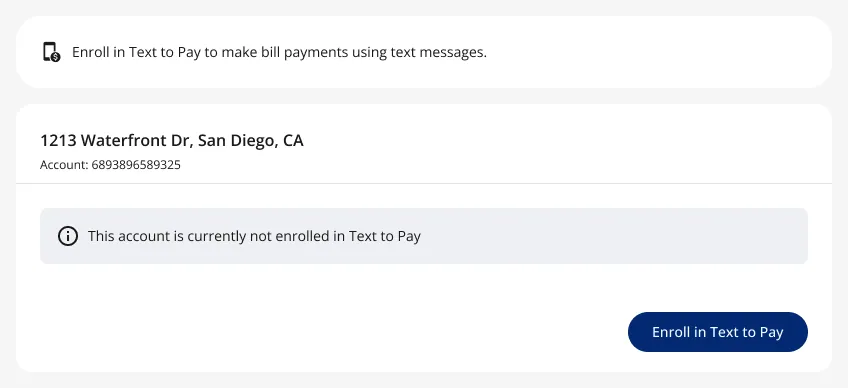
Same pattern elsewhere · Text to Pay: not enrolled
-
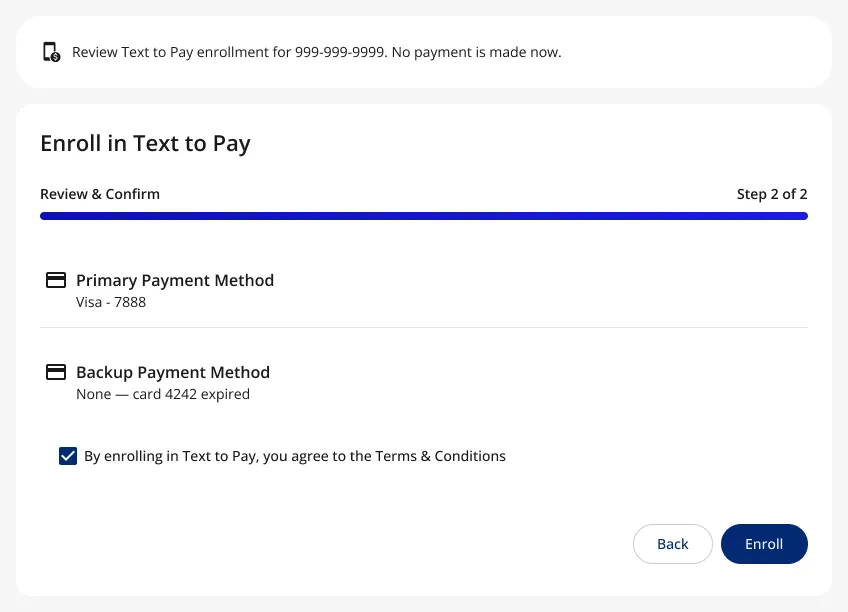
Same pattern elsewhere · Text to Pay: review
-
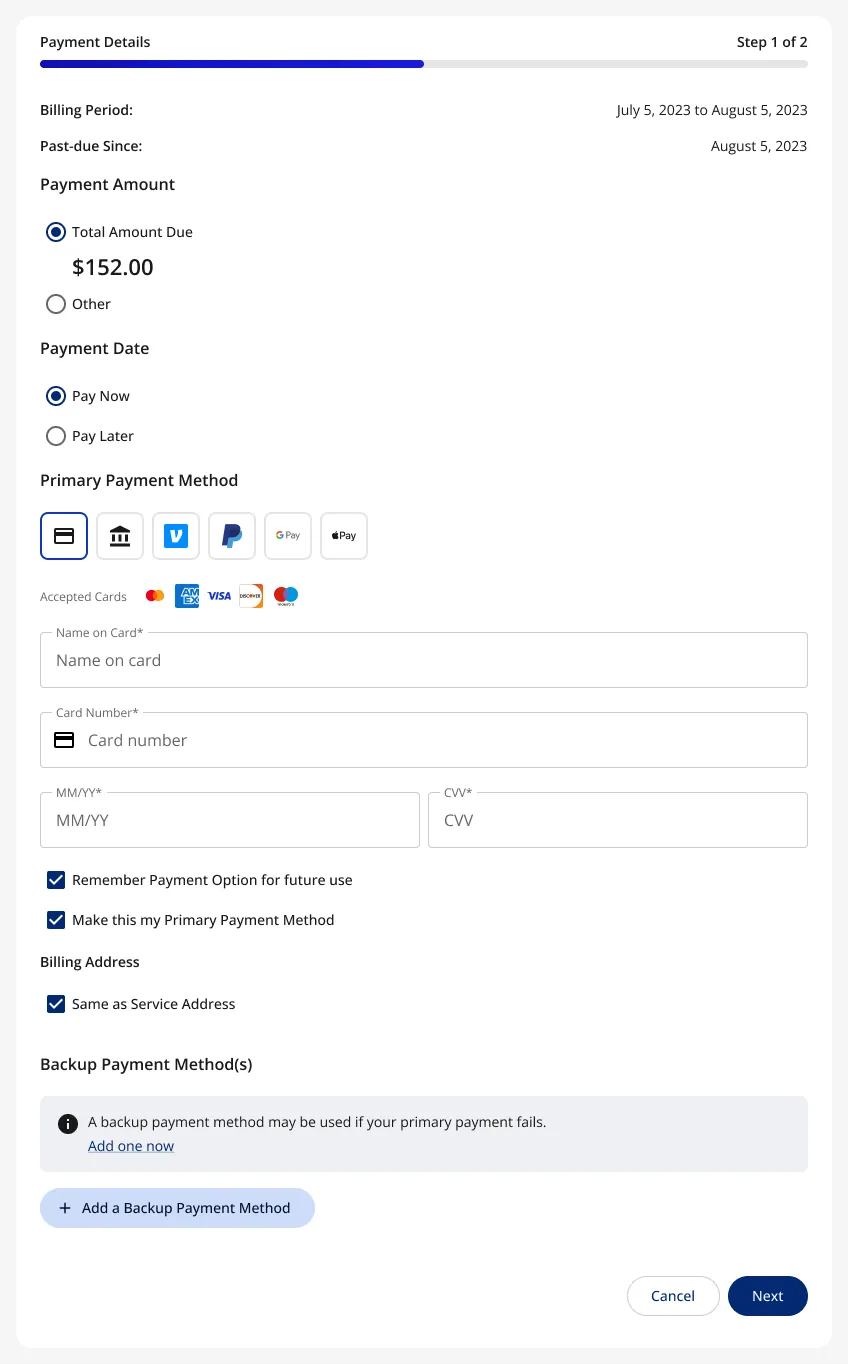
Same pattern elsewhere · Make a Payment, with a backup method
-
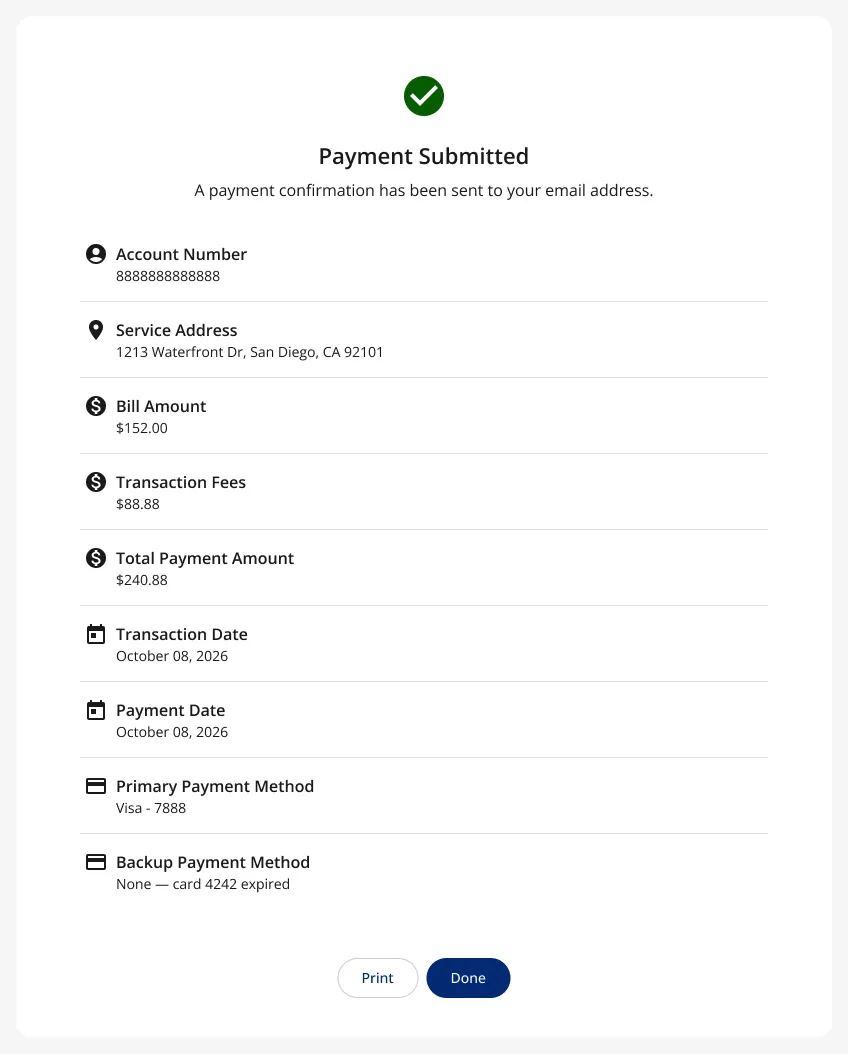
Same pattern elsewhere · Payment submitted
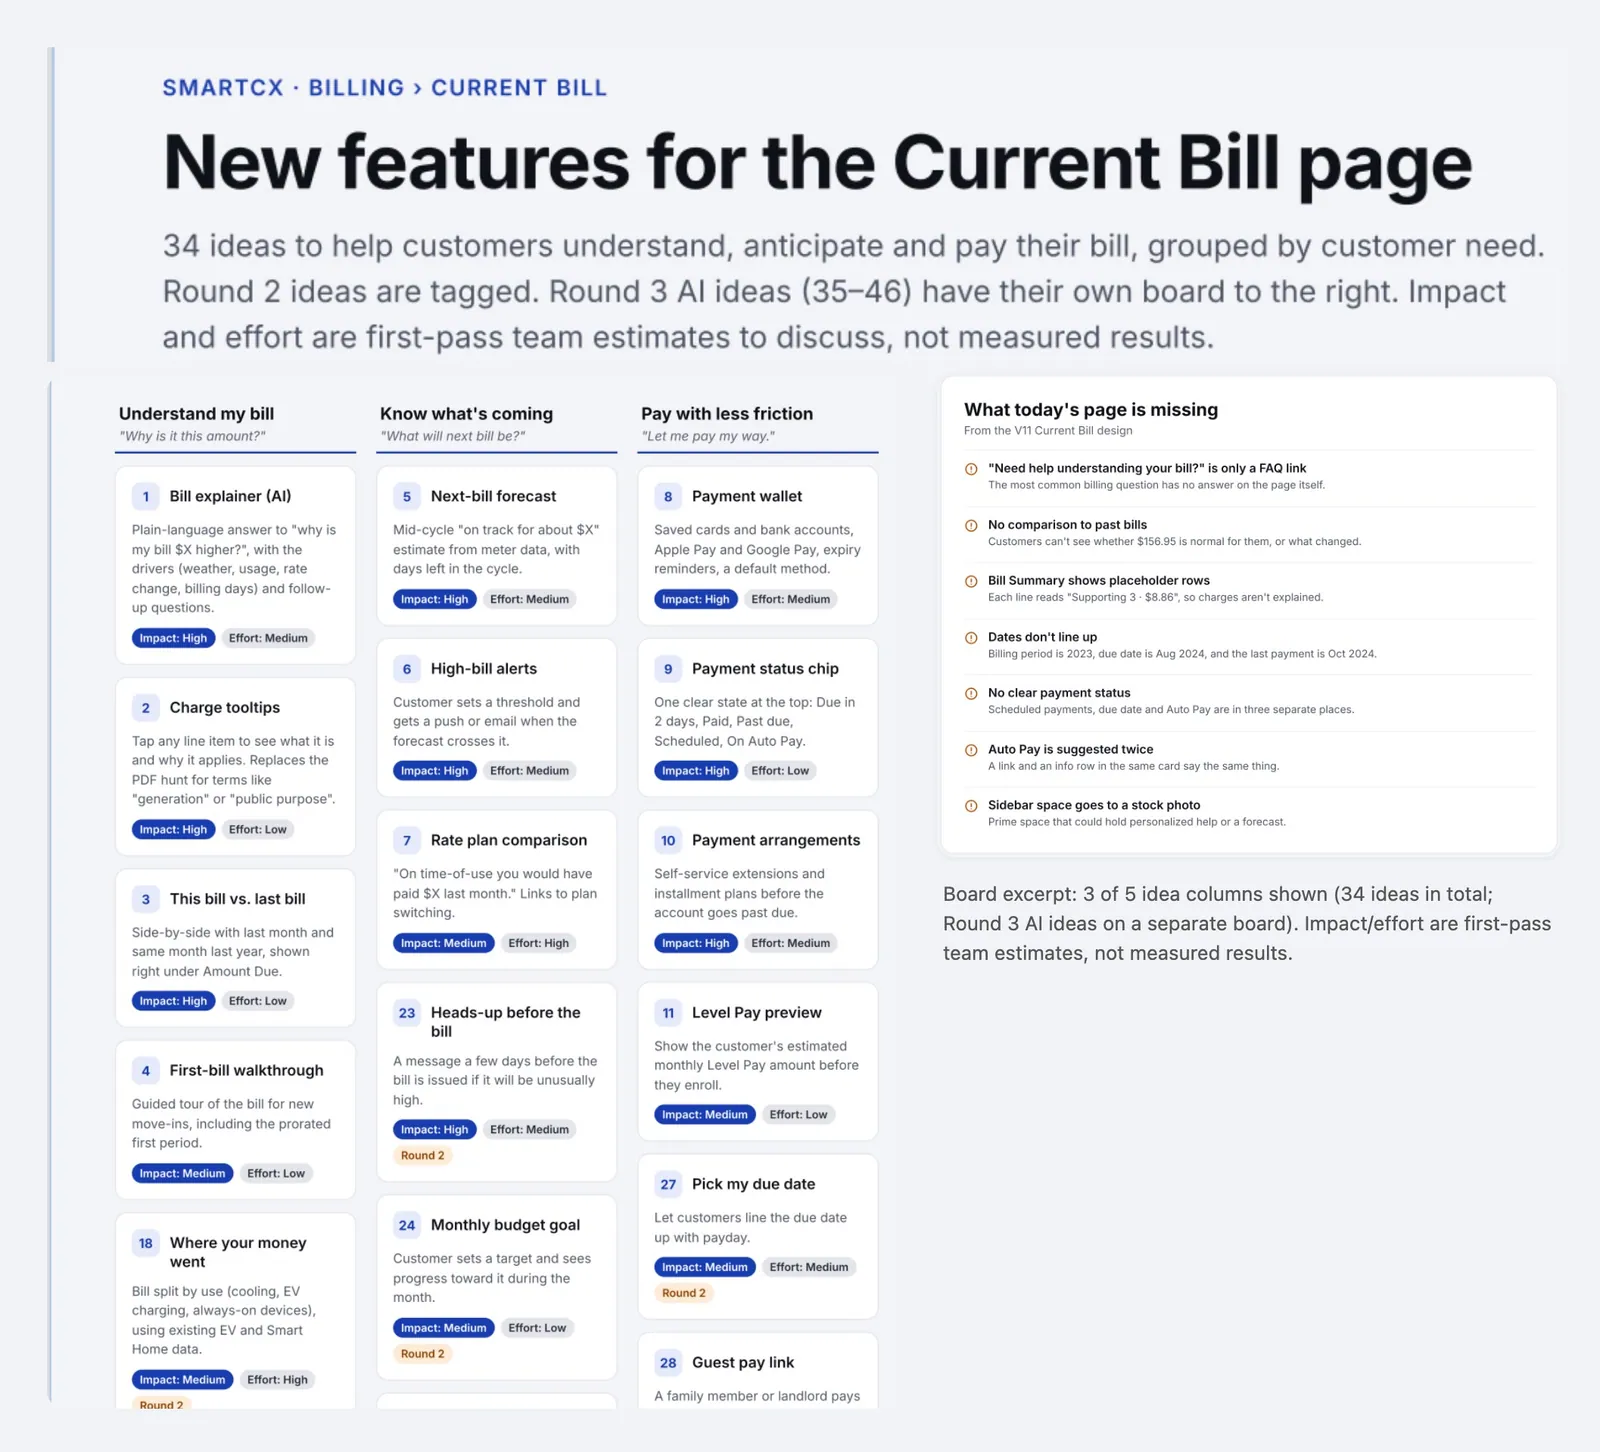
Current Bill Innovation Board (Oct 28, 2026): what today's bill page is missing, then ideas grouped by customer need and tagged by impact and effort.
Surveys, from the customer's home profile to an admin survey builder
On the admin side, I reworked the survey builder for a client demo (a public power utility) from Product's brief: pick a segment, trigger and frequency, drag in questions (rating, thumbs, NPS, text, options), preview, publish and read the results. On the customer side, the About My Home survey collects home details for the home-energy model.
- Area
- Surveys
- When
- 2025–Oct 2026
- Role
- Design of both, plus a clickable Figma prototype of the admin builder for the demo.
- Status
- Client demo, Oct 15, 2026. The client's decision is pending.
-
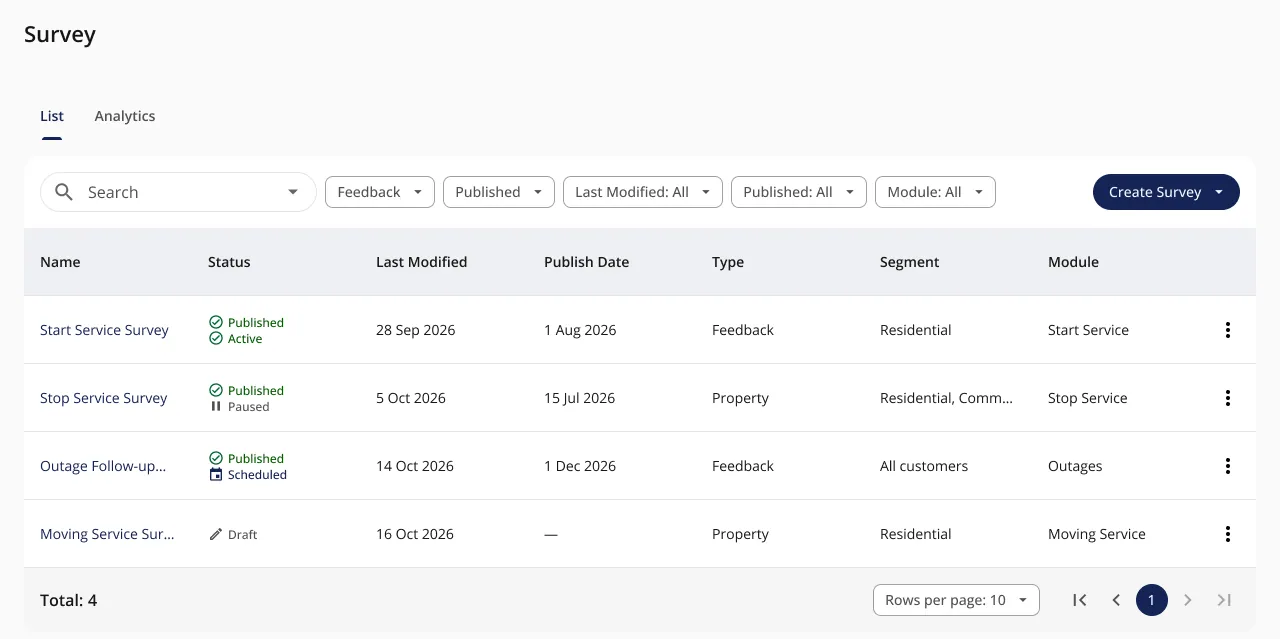
Admin survey builder · Survey list
-
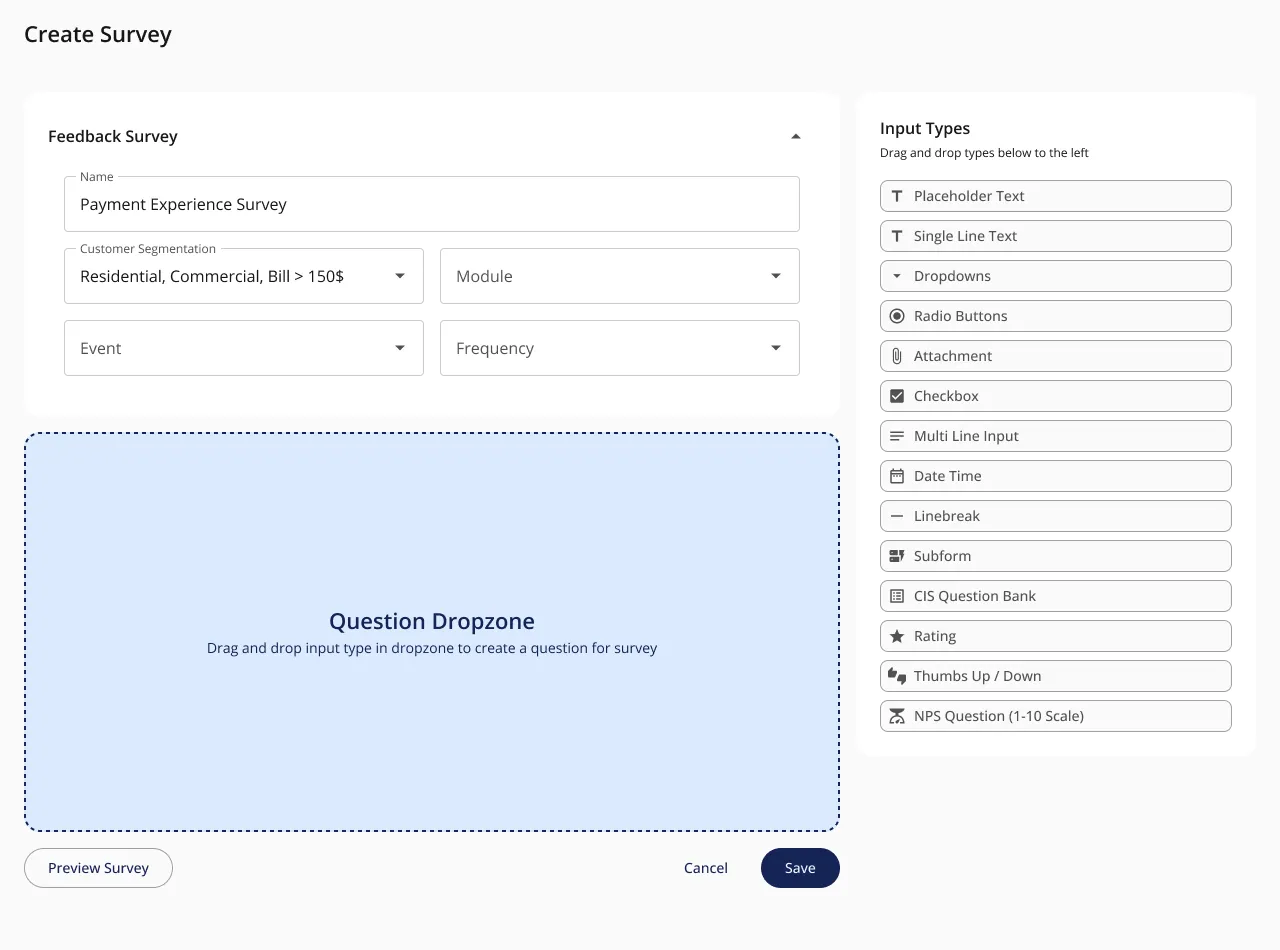
Admin survey builder · Segmentation
-
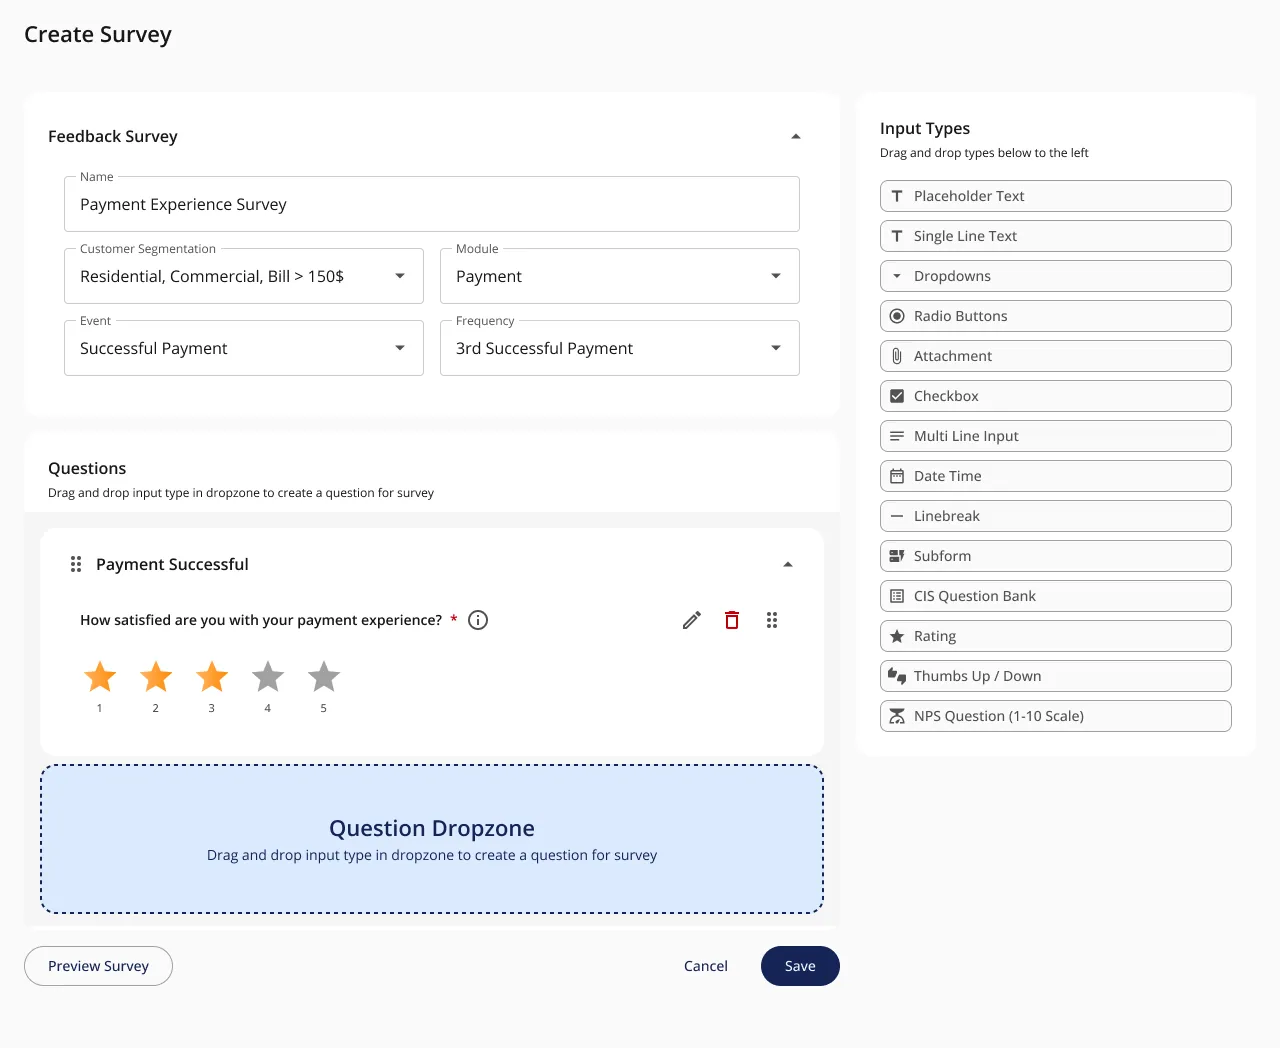
Admin survey builder · Add a rating question
-
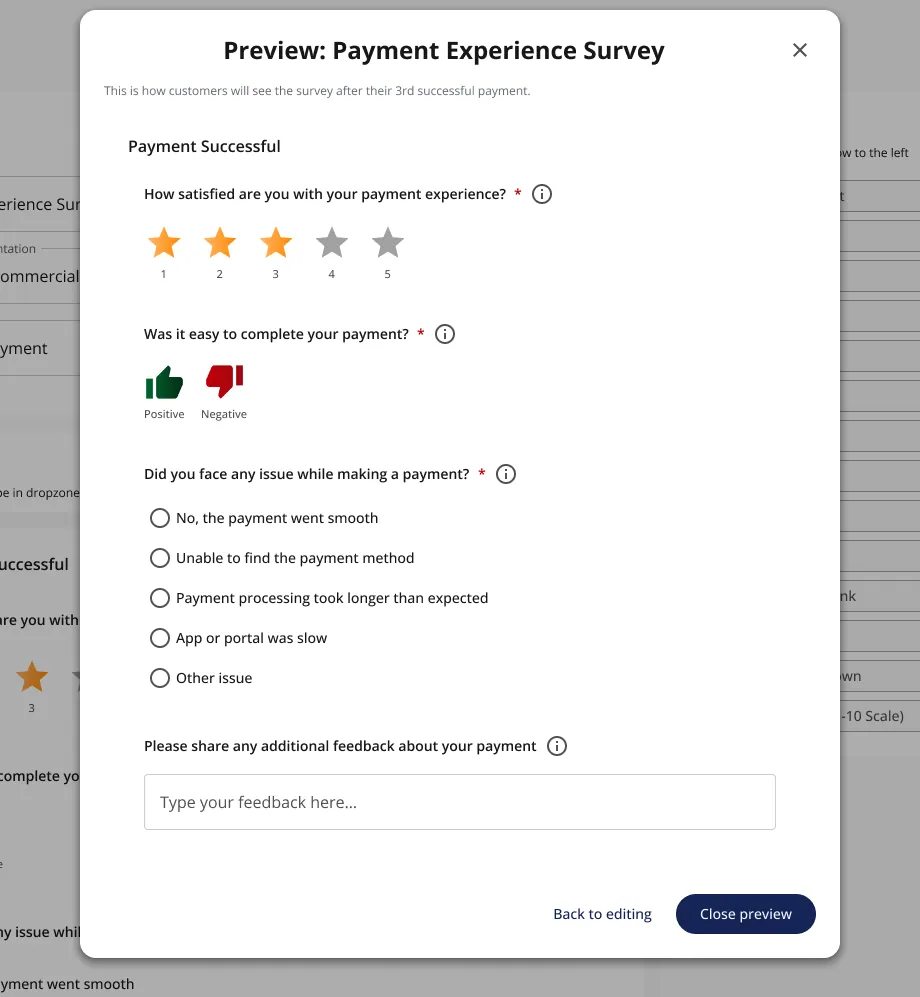
Admin survey builder · Preview
-
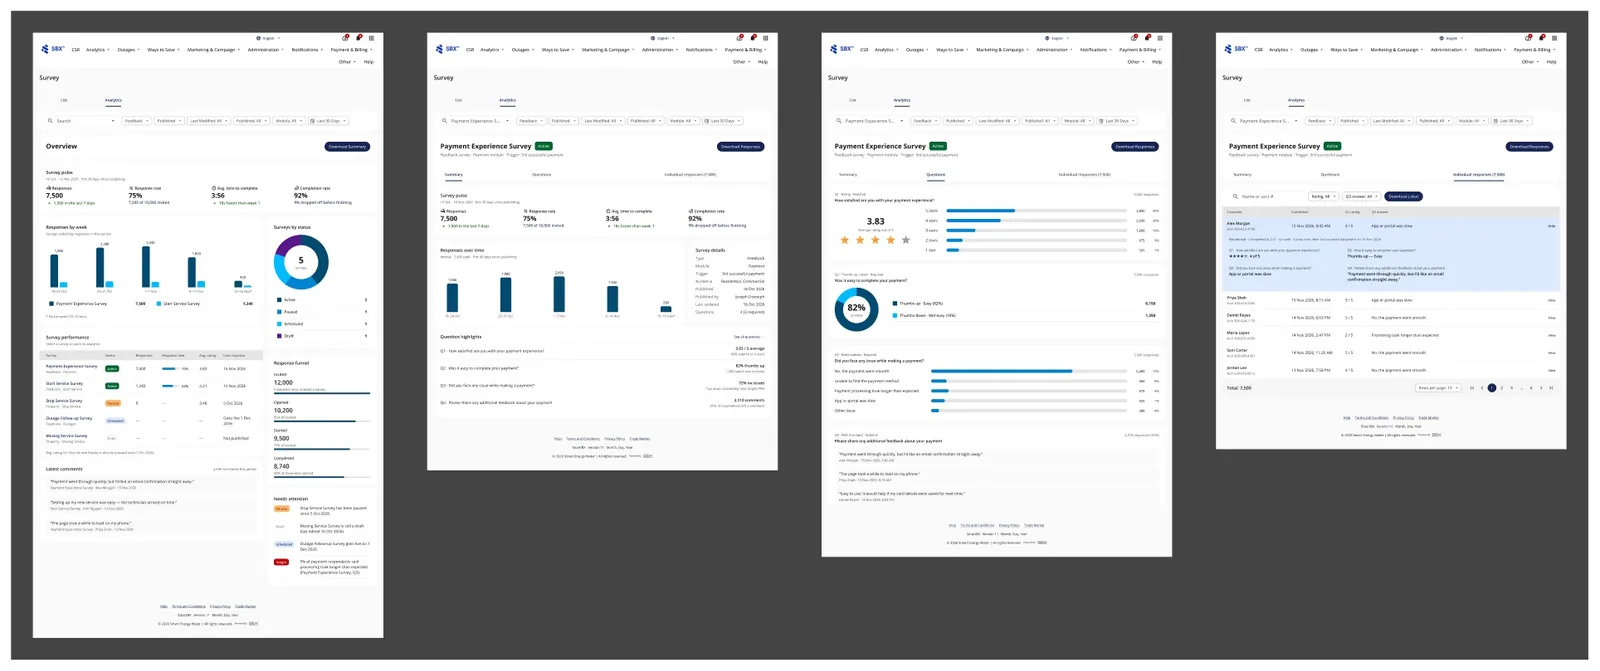
Admin survey builder · Survey analytics
-
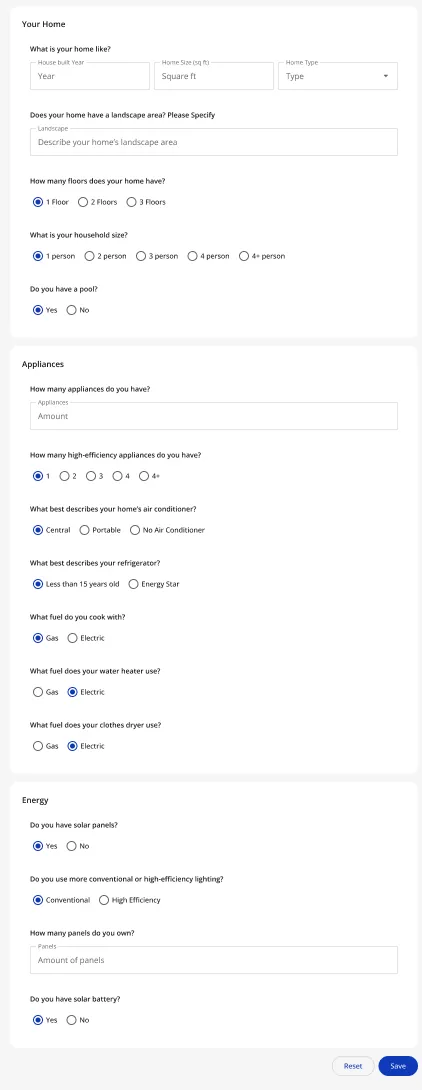
Customer side · About My Home, the customer side · scroll ↕
-
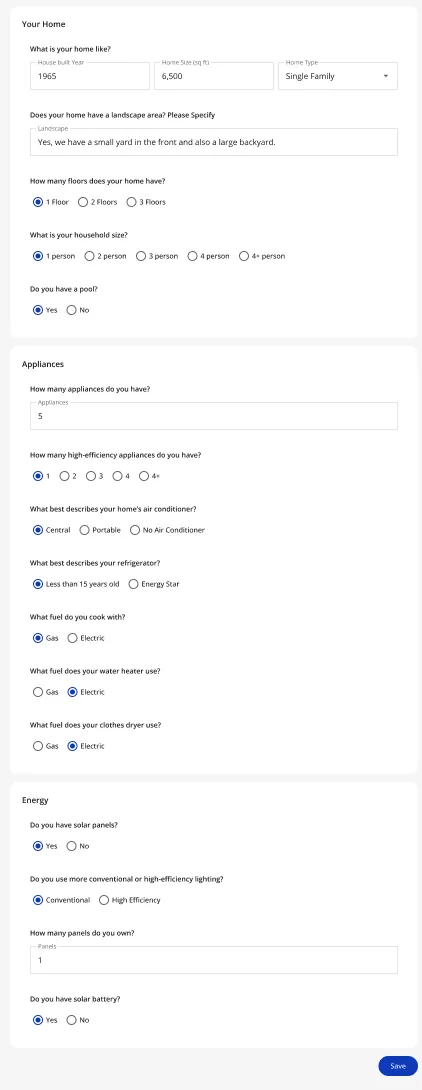
Customer side · About My Home, answered · scroll ↕
Smart Home Energy Reports (SHER): campaigns a utility can run itself
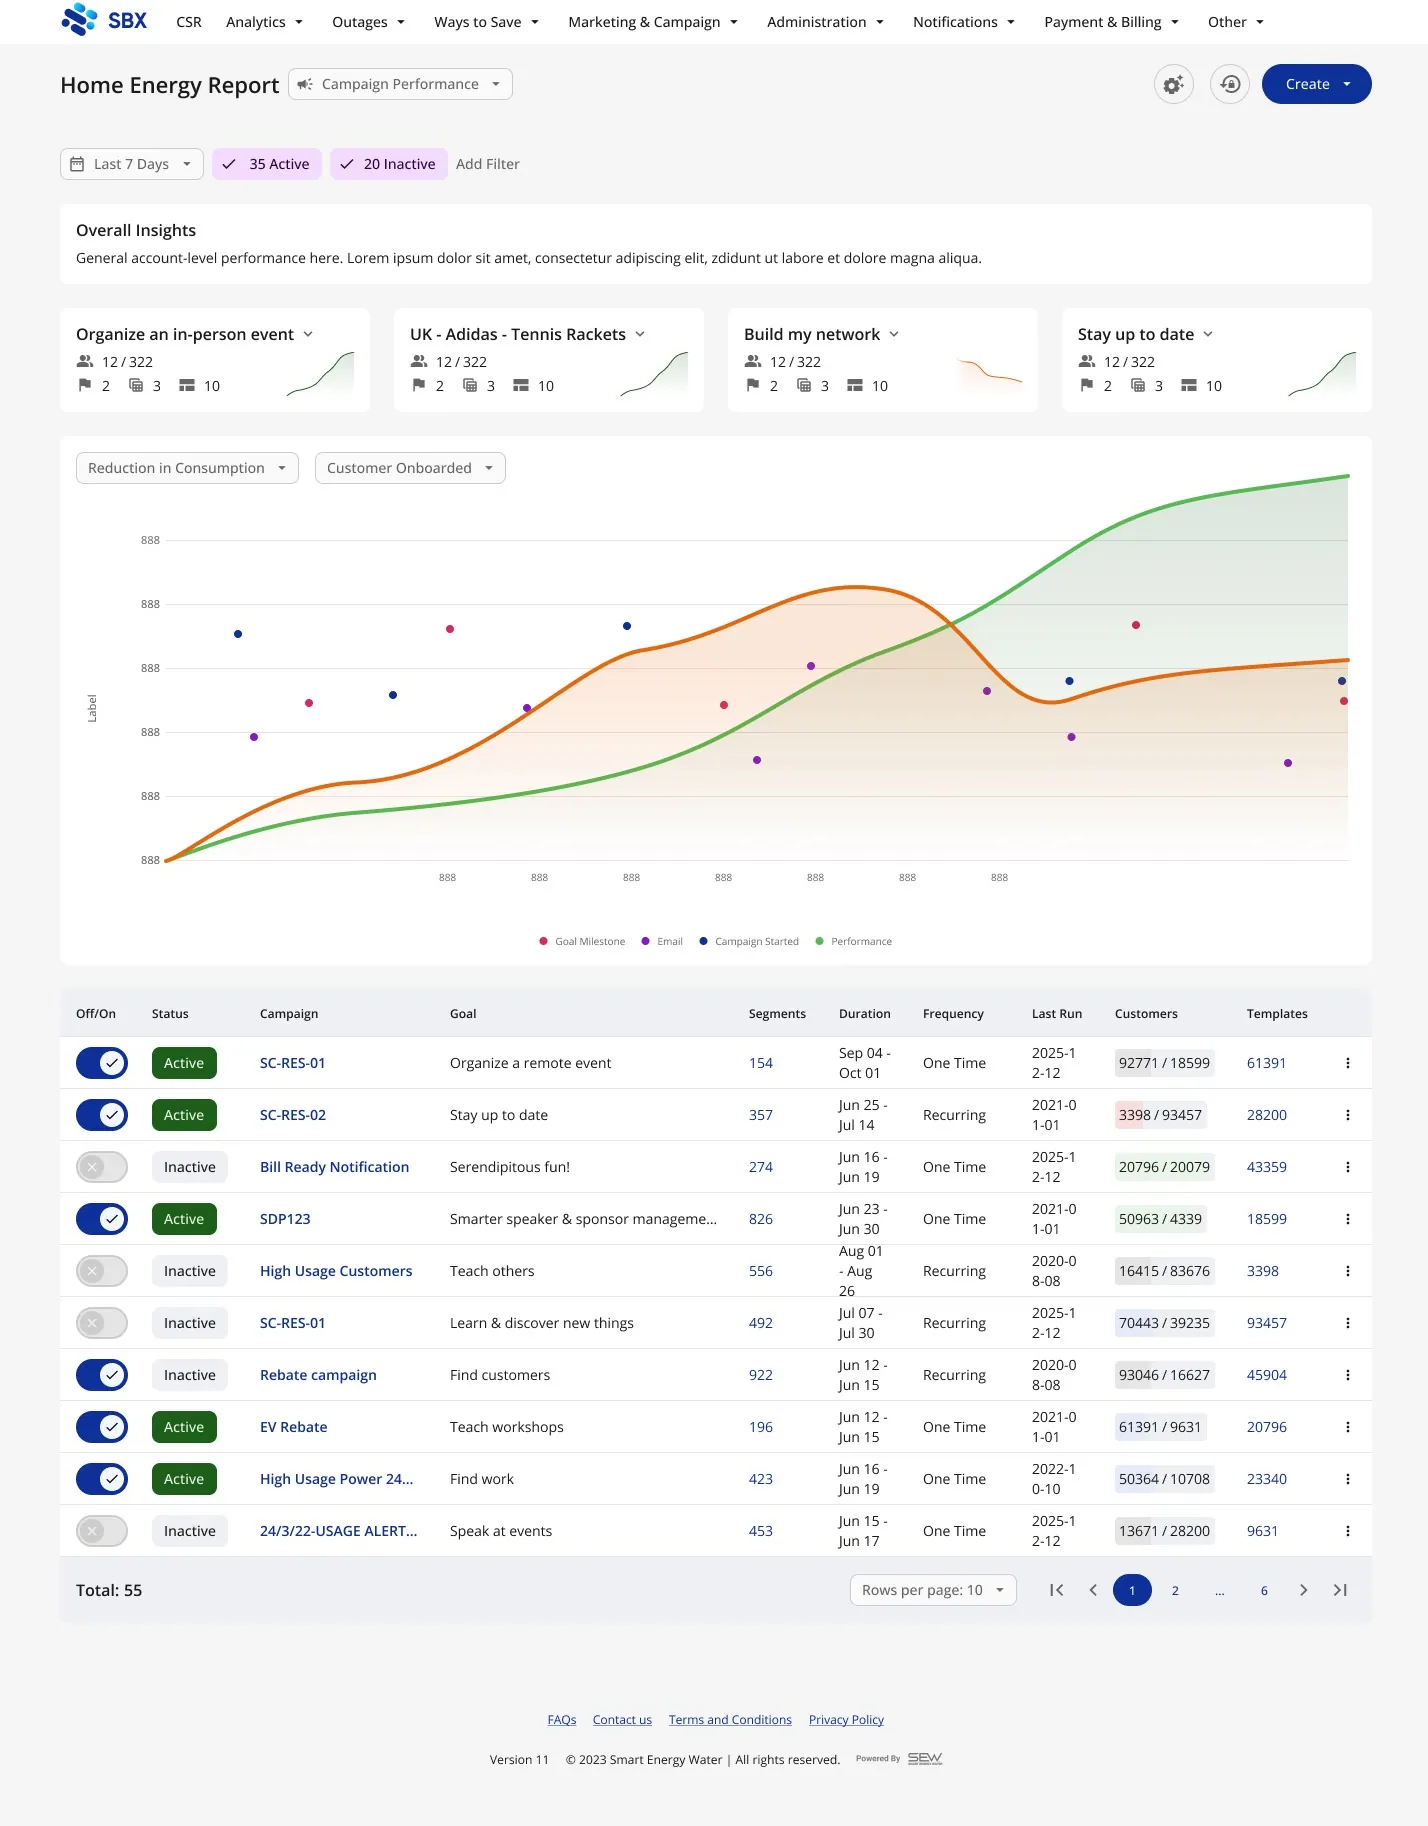
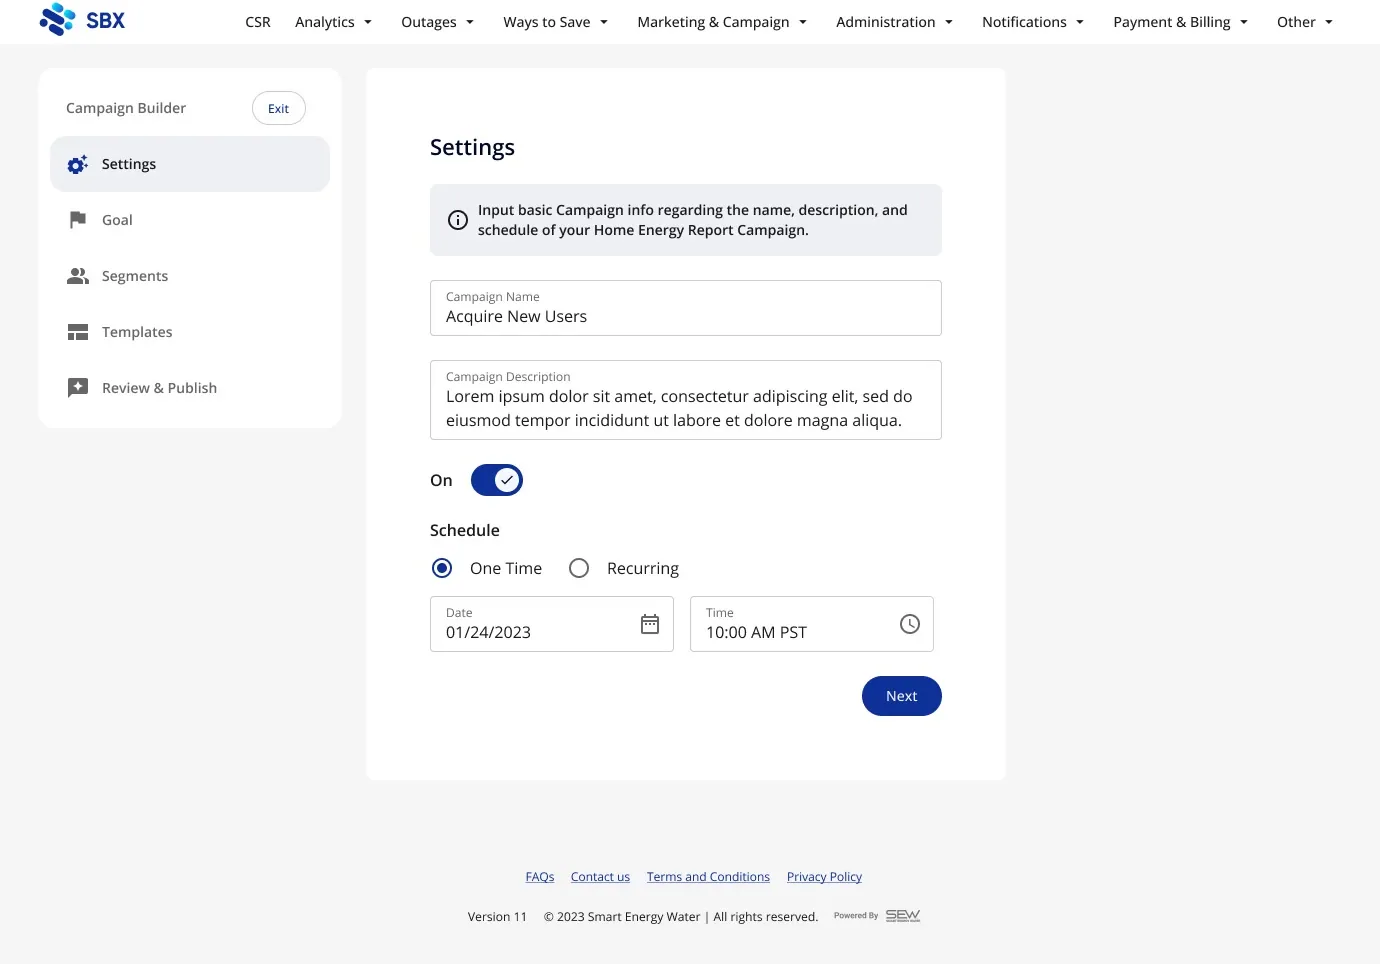
An admin tool for utility staff to build and track SHER campaigns: pick a goal, a customer segment and a template, then watch reach and savings. One of my most-discussed files: 138 working sessions and 51 comments.
- Area
- Smart Home Energy Reports (SHER) · Admin
- When
- Jan 2024, my first project at SEW
- Role
- Design, from the team's rough wireframes to the Figma file.
- Status
- Design only, explorative concept.
It started as a deck of rough wireframes and a request: utilities could send SHERs, but couldn't create campaigns, segments or goals themselves. Before designing, I wrote down what we didn't know, then played it back as one user story and one data model.
User story
Who it is for"As an Admin (Marketing Manager equivalent)… I want to easily/quickly create and track goals to hit with campaigns to send SHER's to defined segments."
Data model
Goals → Campaigns → Segments + TemplatesOne goal has many campaigns. Segments and templates are reused across campaigns.
The question I pushed on
How much for the first release?Does it need one-to-many-to-many, or one campaign per segment per template?
-
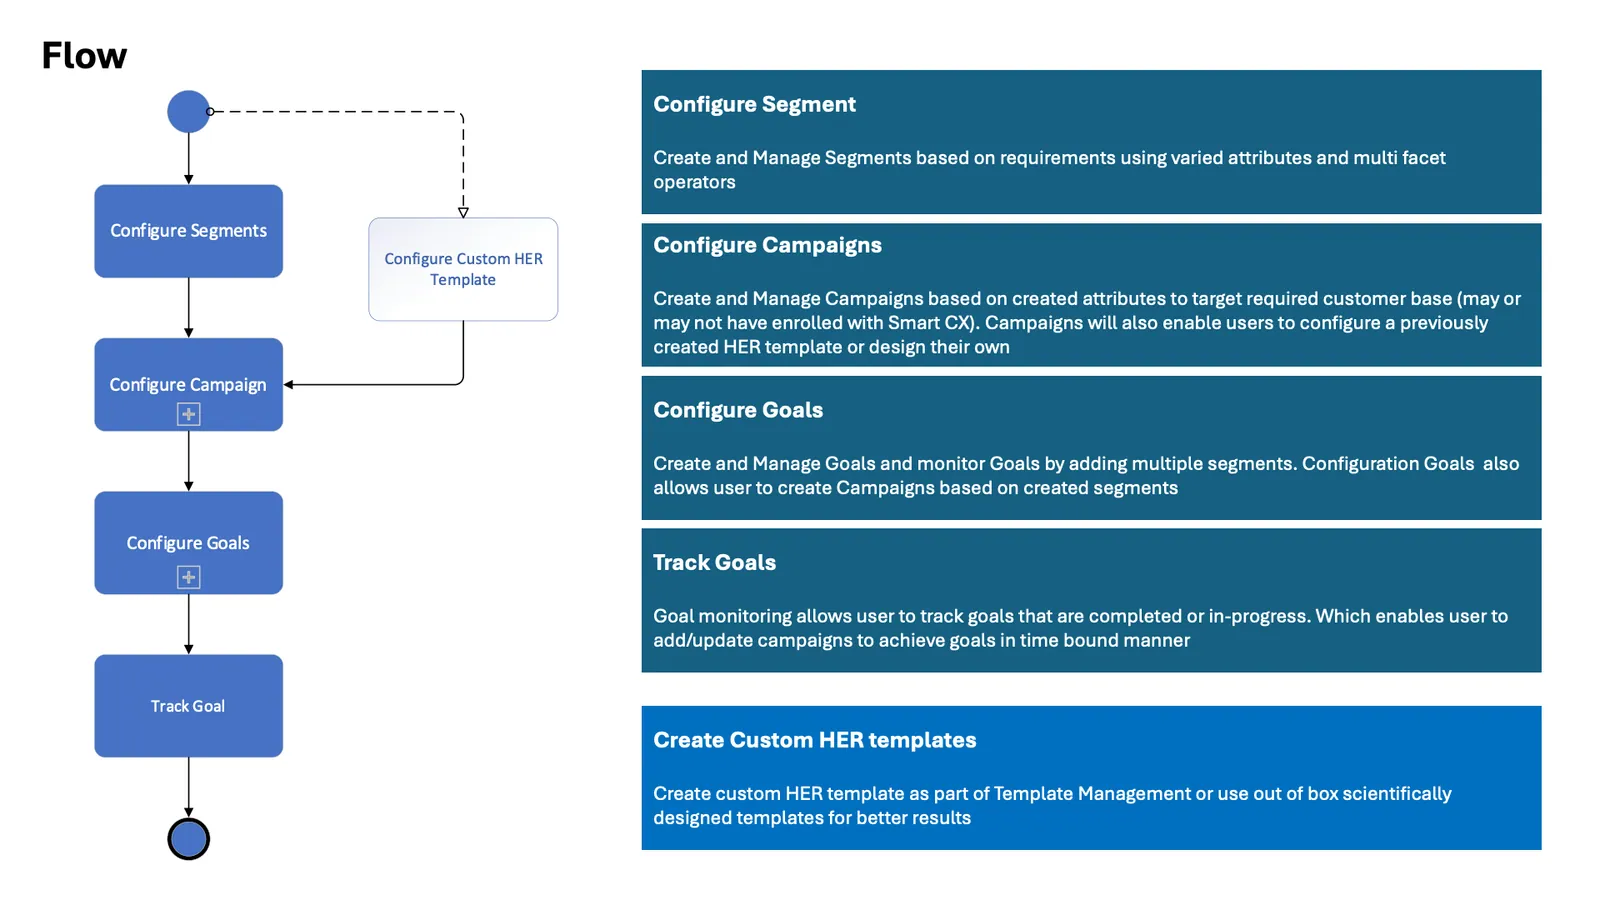
The flow: segments, campaigns, goals, tracking
-
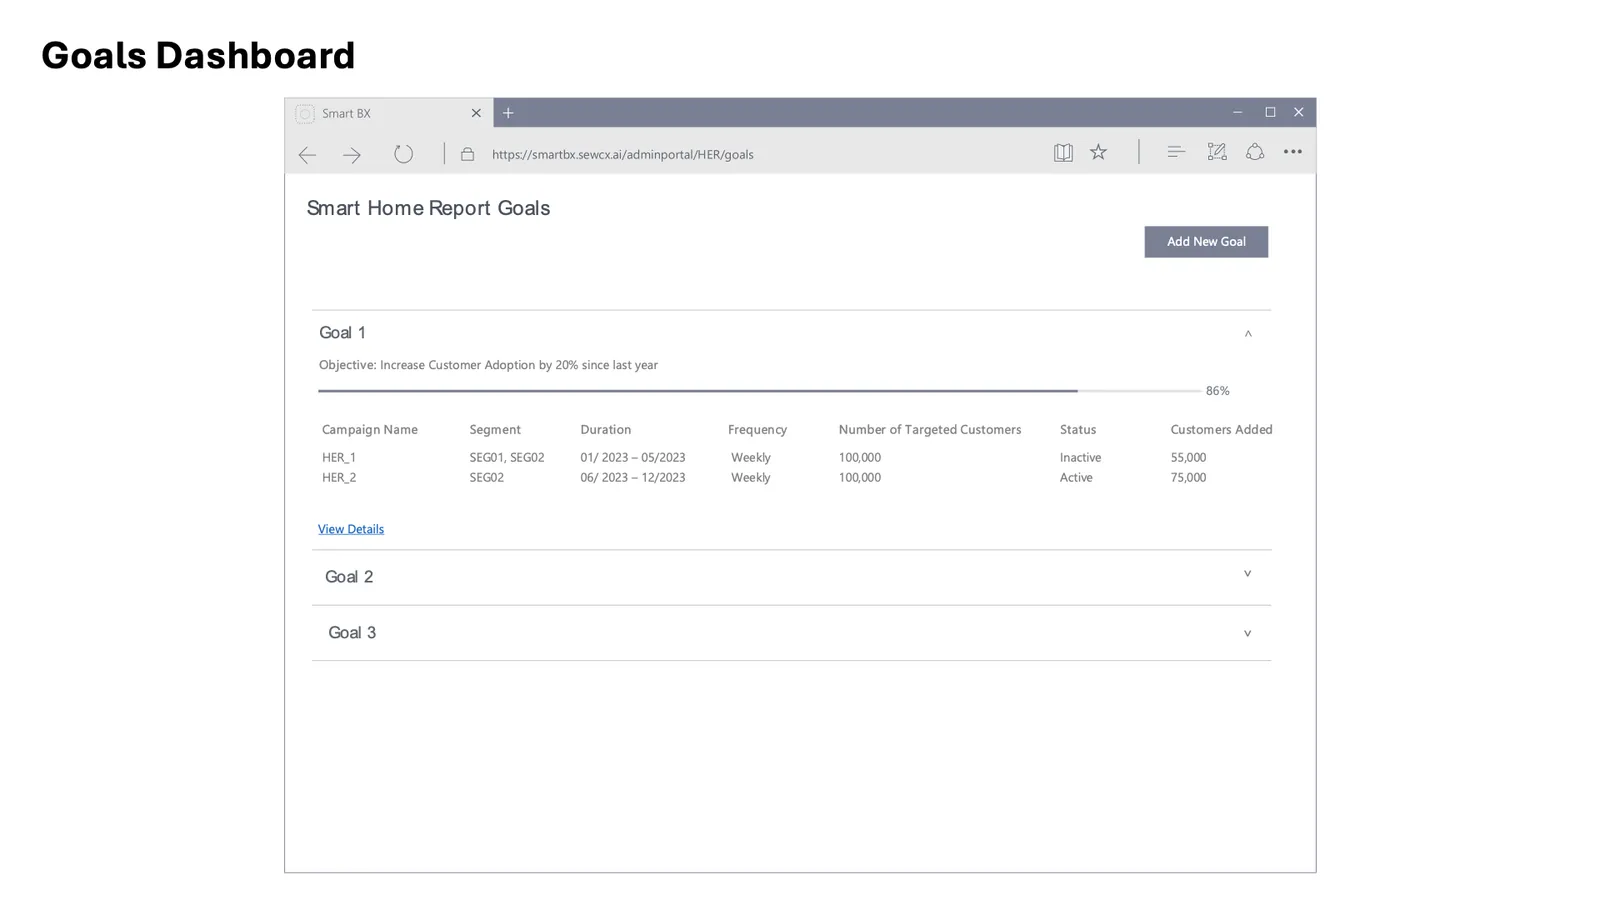
Goals dashboard
-
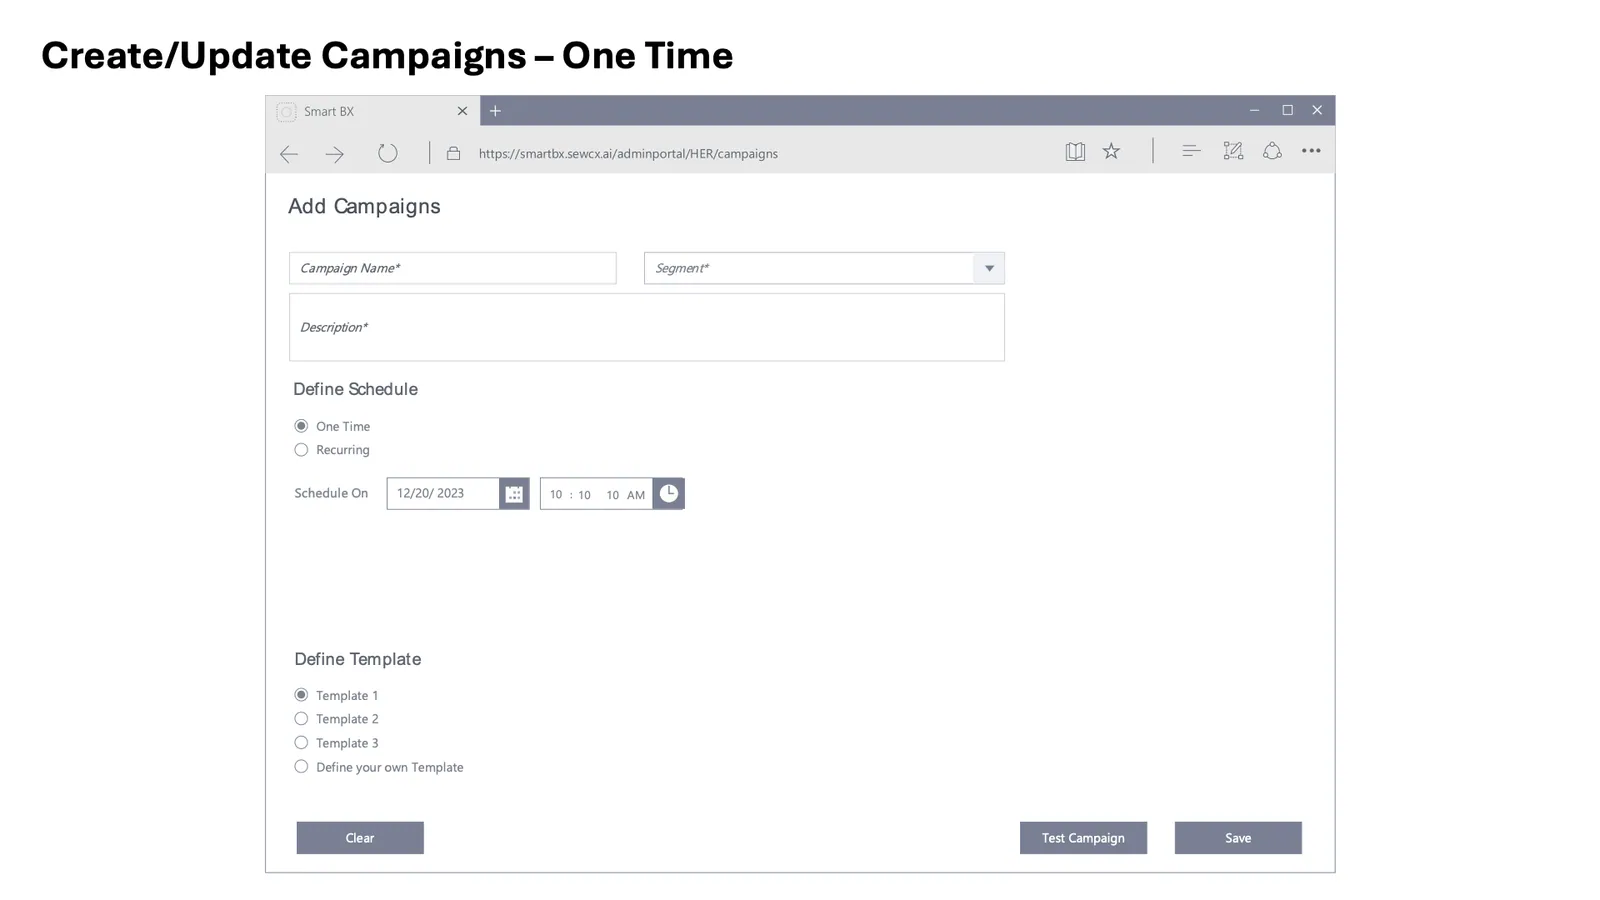
Add a campaign
-
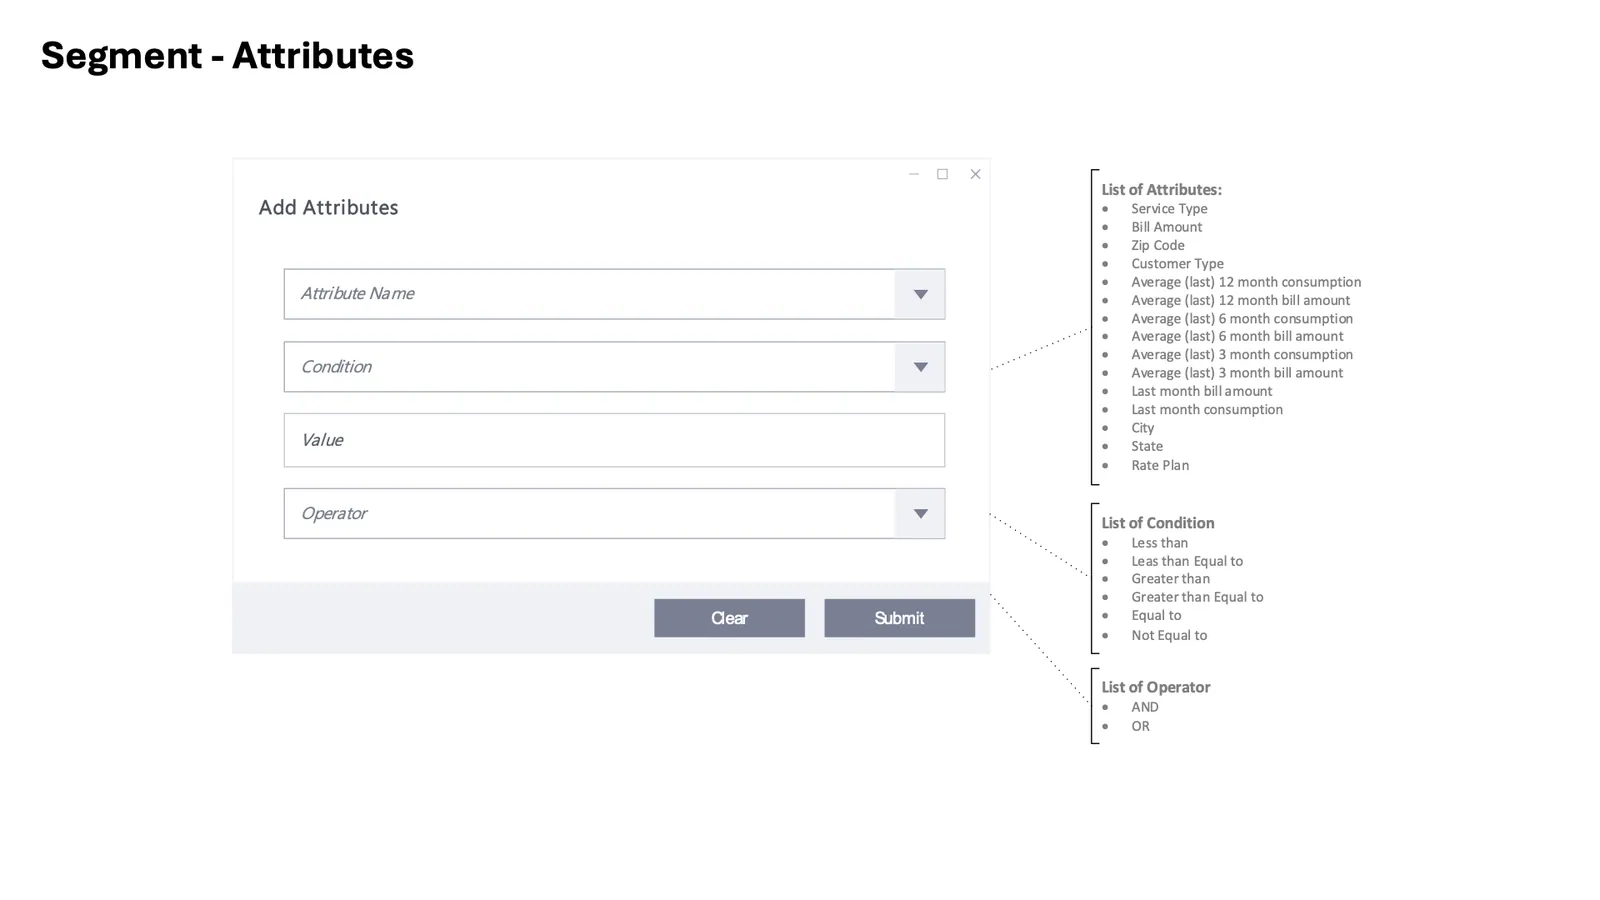
Segment attributes